
Please help to check my IELTS writing
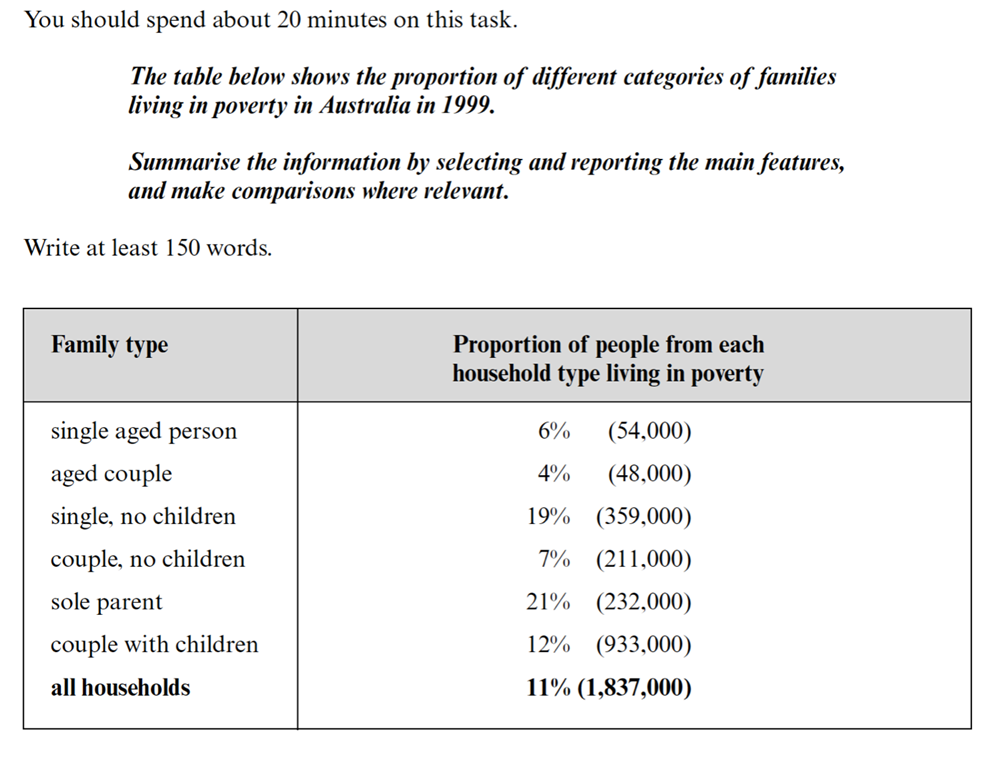
The table gives information about six different types of families and the proportion of each household type living in poverty in the year of 1999 in Australia.
The proportion of all households living in poverty was 11%, which was almost two million people in total. Overall, aged people seemed to be more financially comfortable, and poverty rates of couples generally tended to be lower than those of single persons.
Aged people tended to be in less poverty than the other family types. The percentage of aged couples and single aged persons who lived in poverty was relatively low, weighing 4% and 6% respectively.
The highest proportion household type was sole parents, which was 21%. The proportion of couples with children was almost 10% lower than that of sole parents. The same pattern could be seen for people without children. The proportion of single persons without children was 19%, and the proportion of couples without children was 7%.
Top answer
The table gives information about ("Information about" is very vague. ) six different types of families and the proportion of each household type living in poverty in the year of 1999 in Australia. Suggestion: The table lists six different types of households, such as singles and couples with and without children, and the number and percentage of members of these groups who were living below the poverty line in Australia in 1999.
- The table gives information about ("Information about" is very vague.
- ) six different types of families and the proportion of each household type living in poverty in the year of 1999 in Australia.
- Suggestion: The table lists six different types of households, such as singles and couples with and without children, and the number and percentage of members of these groups who were living below the poverty line in Australia in 1999.
- It also gives that information for all households.
- The proportion of all households people living in poverty was 11%, which was or almost two million people in total.
Get the Weekly English Kit 📬
New words, one handy idiom, and a 2-minute quiz — delivered to your inbox to keep your streak alive.
The table gives information about ("Information about" is very vague. Besides the percent in poverty, what other information is there?) six different types of families and the proportion of each household type living in poverty in the year of 1999 in Australia.
Suggestion:
The table lists six different types of ho
 Related Questions