
Please Help Review My Task 1
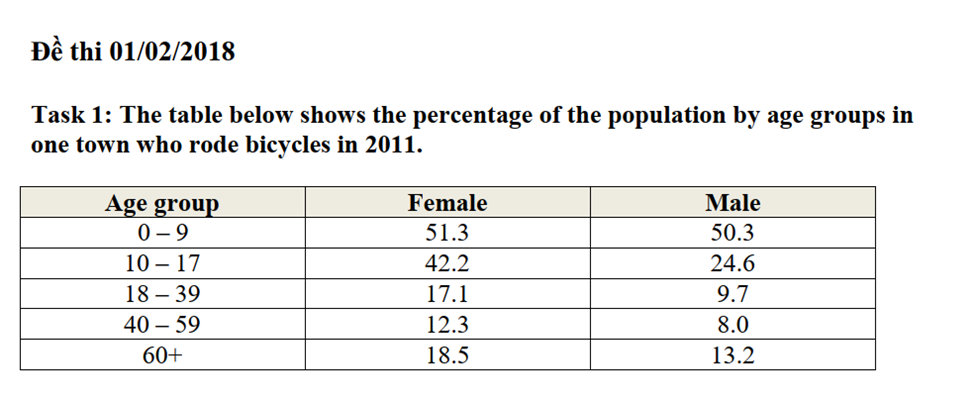
The table compares the proportions of the population according to five age brackets in one town whose means of transport was the bicycle in 2011. Overall, residents aged 0-9 used bicycles most frequently while those who were between 40 and 59 recorded the lowest frequency. Additionally, females were estimated to ride bicycles more often than their male counterparts regardless of their age.
With regard to the age group 0-9, the percentages of girls and boys who rode bicycles were quite identical, at approximately 51. However, it is manifest in the 10-17 demographic that the gap between these two genders was widened considerably, with the proportion of females opting for this means of transport nearly doubling that of males, about 42.2 and 24.6 percent correspondingly.
Concerning the 18-39 age bracket, there was a twofold decrease in the number of both genders who rode bicycles in 2010, 17.1 and 9.7 percent respectively. Whereas, in terms of the 40-59 and 60+ age groups, the figure for women outnumbered that of men by relatively 4 percent.
Top answer
Please read my advice for Task 1 essays. IELTS TASK 1: Hints, Tips And Advice Vocabulary Words For Task 1: Reference Post
- Please read my advice for Task 1 essays.
- IELTS TASK 1: Hints, Tips And Advice Vocabulary Words For Task 1: Reference Post
Get the Weekly English Kit 📬
New words, one handy idiom, and a 2-minute quiz — delivered to your inbox to keep your streak alive.
The table compares the proportions of the population in one town, divided into according to five age groups, brackets in one town whose means of transport was the (That is not quite right. People drive to work in a car, and then might go for a bike ride for fun with the chi
Task: Table showing the percentage of people by gender and age group who rode a bicycle in 2011.
Sample essay (~180 words)
Outline:
Paragraph 1: Describe the table and its rows and columns.
Paragraph 2: Point out the main features.
Paragraph 3: Point put some details. Focus on making comparisons.
The table lists the percentages of people who rode bicyc
 Related Questions