
Please help review my task 1
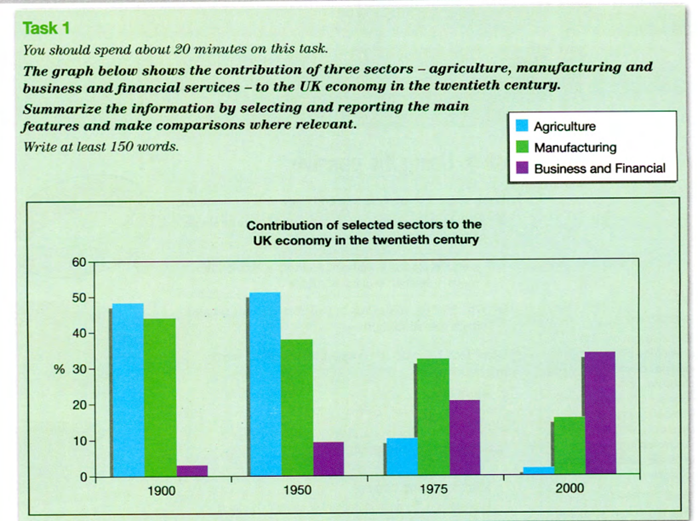
The bar graph compares the proportion for three specific industrial contributors, namely agriculture, manufacturing, business and financial, to the UK economic growth in four separate years 1900, 1950,1975 and 2000.
Overall, while there was a significant decrease in the contribution of agriculture and manufacturing, the UK economy developed thanks to the increasing percentage of business and financial over the period.
In detail, during the first five decades, agricultural percentage rose slightly, constituting half of the British economy, but its contribution suddenly plummeted to 10% in 1975 and a negligent portion in 2000, the lowest across three sectors, respectively. Likewise, the manufacturing contribution showed a gradual drop during the years, which halves lower than its initial proportion, from 45% to 19%. For business and financial, the pattern was reversed, as it rose significantly, being sevenfold as much as the portion in 1900 from a modest 5% to 35% in 2000, which made it the highest point of all.
Top answer
The bar graph compares the proportion al contributions of for three specific sectors industrial contributors , namely agriculture, manufacturing, and business and financial, to the UK economy economic growth in four separate years 1900, 1950, 1975 and 2000. Overall, while there was a significant decrease in the contribution of agriculture and manufacturing, the UK economy developed thanks to the increasing percentage (That is an opinion statement. Do not give any opinions, deductions or conclusions in Task 1.
- The bar graph compares the proportion al contributions of for three specific sectors industrial contributors , namely agriculture, manufacturing, and business and financial, to the UK economy economic growth in four separate years 1900, 1950, 1975 and 2000.
- Overall, while there was a significant decrease in the contribution of agriculture and manufacturing, the UK economy developed thanks to the increasing percentage (That is an opinion statement.
- Do not give any opinions, deductions or conclusions in Task 1.
- ) of the business and financial became significant part at the end of the century in comparison with the start.
- over the period .
Get the Weekly English Kit 📬
New words, one handy idiom, and a 2-minute quiz — delivered to your inbox to keep your streak alive.
The bar graph compares the proportional contributions of for three specific sectors industrial contributors, namely agriculture, manufacturing, and business and financial, to the UK economy econo
 Related Questions