
Please Help Review My IELTS Writing Task 1
Topic: The pie charts below show the main reasons why students chose to study at a particular UK University in 1987 and 2007. Summarise the information and Write at least 150 words.
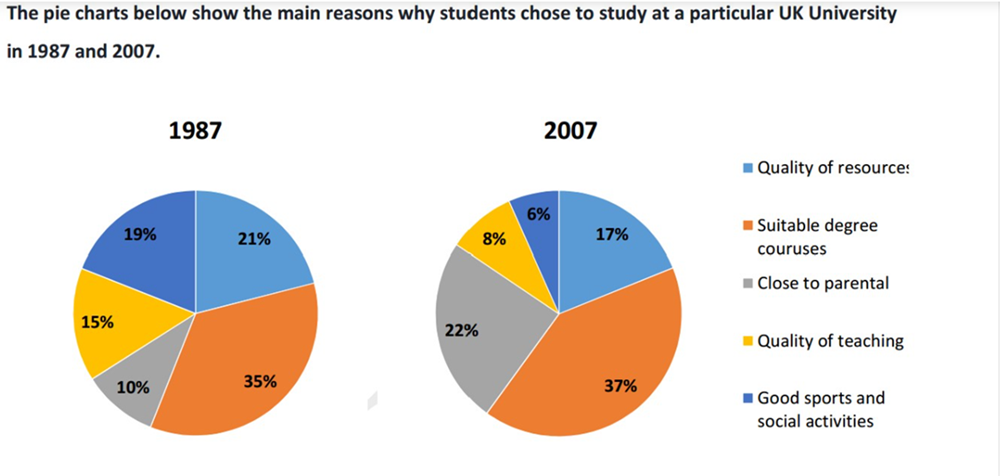
The pie charts compare five main rationales behind students’ decision to study at a UK University in 1987 and 2007.
Overall, while the volume of students opting for the university because of its quality of teaching, quality of resources and adequate sporting and social events decreased, the figures for the suitability of degree courses and close to parental had the opposite trend. Additionally, the suitability of degree courses remained the main reason for students’ decision to study at the institution in two years (1987 and 2007).
In detail, over a third of students opted for the UK University as they felt suited to its degree courses in both years, constituting the largest share of the charts. In 1987, roughly one out of five students studied at the educational institution for its quality resources, almost two-fold of those choosing for being close to their parents. However, after 20 years, while the percentage of the former dropped by 4 percent, that of the latter nearly doubled. In addition, whereas about one-third of students’ reasons to study at the university were its education quality and good fitness and social projects in 1987, 15 and 19 percent correspondingly, both ratios declined by 5% and 13% respectively in 2007.
Top answer
Please read my advice for Task 1 essays. IELTS TASK 1: Hints, Tips And Advice Vocabulary Words For Task 1: Reference Post
- Please read my advice for Task 1 essays.
- IELTS TASK 1: Hints, Tips And Advice Vocabulary Words For Task 1: Reference Post
Get the Weekly English Kit 📬
New words, one handy idiom, and a 2-minute quiz — delivered to your inbox to keep your streak alive.
The pie charts compare five main rationales behind students’ decision to study at a UK University in 1987 and 2007.
That is not what is shown on these charts. Percentages of students are shown, not any comparison of rationales. You did not tell the reader what these categories are.
Overall, while the
 Related Questions