
Please help me. writing task 1.
The charts show how much local authorities spent on a range of services in Someland in three separate years: 1980, 1990 and 2000.
In all three years, the greatest expenditure was on education. But while K-12 education saw a fall from 25% in 1980 to only 18% of spending in 2000, higher education remained the largest proportion, reaching 45% of total spending in 1990 and ending at 40% in 2000.
Expenditure on health and human resources had increased to 20% by 1990 before decreasing to only 10% by the end of the period. In contrast, the share of transportation saw an opposite trend. This cost decreased to only 6% of total expenditure in 1990 but rose dramatically in 2000 when it represented 22% of the total budget. Similarly, the cost of environmental services saw a rising trend, growing from only 4% to 9% by 2000.
Overall, higher education constituted the largest cost to local authorities, and while spending increased for transportation and environmental services, there were corresponding drops in expenditure on health and human resources and K-12 education.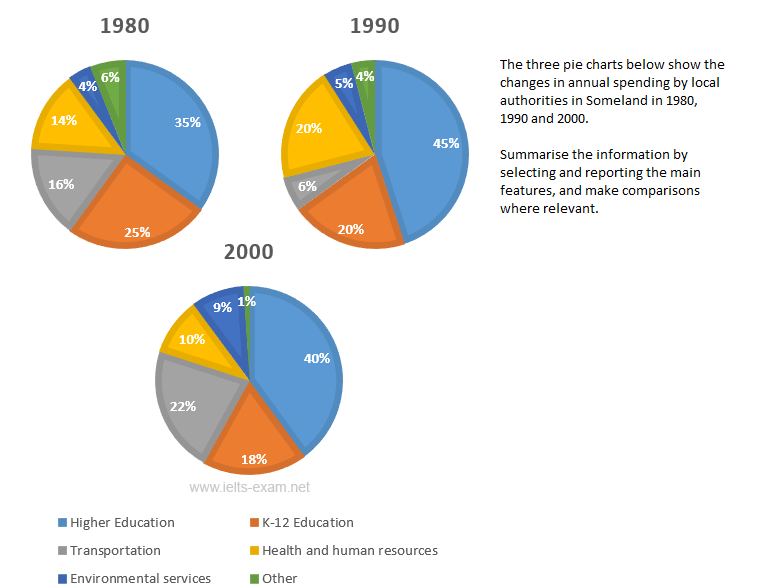
Top answer
The charts show how much local authorities spent on a range of services in Someland in three separate years: 1980, 1990 and 2000. ( If you write "how much," that means the values will be in monetary units such as dollars or euros. The charts show the relative spending by local authorities on a range of items (Education, Transportation, Health and human resources, Environmental services, and other expenditures) in Someland in three separate years: 1980, 1990 and 2000.
- The charts show how much local authorities spent on a range of services in Someland in three separate years: 1980, 1990 and 2000.
- ( If you write "how much," that means the values will be in monetary units such as dollars or euros.
- The charts show the relative spending by local authorities on a range of items (Education, Transportation, Health and human resources, Environmental services, and other expenditures) in Someland in three separate years: 1980, 1990 and 2000.
- ) In all three years, the greatest expenditure was on education.
- ) But while K-12 education saw a fall from 25% in 1980 to only 18% of spending in 2000, higher education remained the largest proportion, reaching 45% of total spending in 1990 and ending at 40% in 2000.
Get the Weekly English Kit 📬
New words, one handy idiom, and a 2-minute quiz — delivered to your inbox to keep your streak alive.
The charts show how much local authorities spent on a range of services in Someland in three separate years: 1980, 1990 and 2000.
(
If you write "how much," that means the values will be in monetary units such as dollars or euros.
The charts show the relative spending by local authorities on a range of items (Education, Transportation, Health and human resources, Environmental
 Related Questions