
Please help me writing task 1
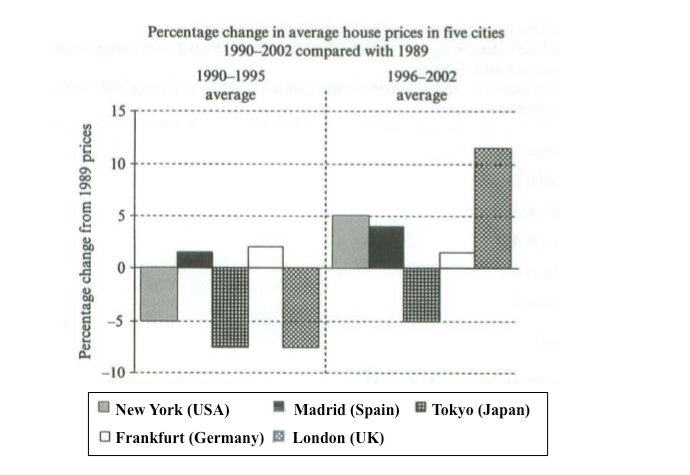
The bar chart compares changes in the average cost of a house in 5 famous cities during the period from 1989 to 2002.
It is clear that house prices fell overall between 1990 and 1995, but most of the cities showed price increases at the same time. Besides that, London experienced the highest growth after 13-year period.
Over the five years after 1989, the percentage change in house prices in London and Tokyo dropped about 7%, while that fall in New York was 5%. By contrast, prices rose by approximately 2% in both Madrid and Frankfurt.
From 1996 to 2002, the average cost of homes in London climbed to around 12% more than in 1989. People who bought house in Madrid and Tokyo had to pay slightly more with a similar further 2% in price, while home prices in Frankfurt remained stable. In addition, homebuyers in New York would have spent the amount of money less than 5%, if they had bought house in 1989 instead of after 1996.
Thank you so much!
Top answer
The yellow highlighted text is very awkward or has errors. The bar chart compares changes in the average cost of a house in 5 famous cities during the period from 1989 to 2002. ) the same time.
- The yellow highlighted text is very awkward or has errors.
- The bar chart compares changes in the average cost of a house in 5 famous cities during the period from 1989 to 2002.
- ) the same time.
- Besides that, London experienced the highest growth after (missing word) 13-year period.
- ) about 7%, while that fall in New York was 5%.
Get the Weekly English Kit 📬
New words, one handy idiom, and a 2-minute quiz — delivered to your inbox to keep your streak alive.
The yellow highlighted text is very awkward or has errors.
The bar chart compares changes in the average cost of a house in 5 famous cities during the period from 1989 to 2002. (That is not an very accurate description of the chart.)
It is clear that house prices fell overall between 1990 and 1995, but most of the cities showed price increases at (How c
 Related Questions