
Please help me woth my writing task 1 ( bar chart)
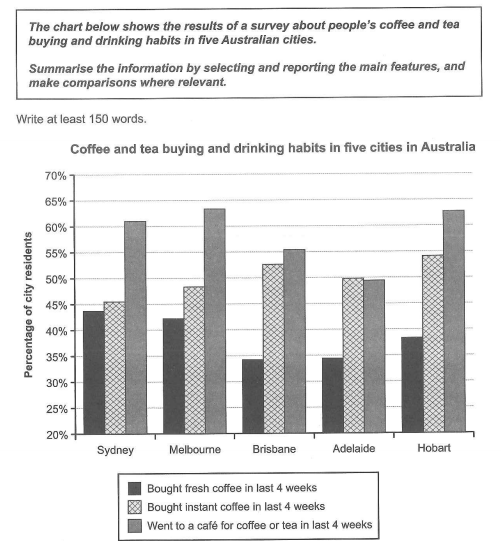
The bar graph compares the percentage of inhabitants have three diferrent coffee and tea buying and drinking habits in Sydney, Melboume, Brisbane, Adelaide and Hobart in last 4 weeks. These three habits comprise bringing fresh coffee, bringing instant coffee and going to a café for coffee or tea.
Overall, less than 45% brought fresh coffee and more than this level brought instant coffee and went to a café. The pattern was that people went to a café most and brought fresh coffee least in each city. The exception was being in Adelaide, where people brought instant coffee more than going to a café.
In detail, the city which had the largest percentage of people bringing fresh coffee was Sydney, with about 44%. The highest level for bringing instant coffee was 53% in Brisbane. Melboume had most people going to a café for coffee or tea, with around 63%. Sydney had the lowest difference between the value for bringing instant and fresh coffee, which was 2%. Adelaide had an unclear gap between the percentage of inhabitants bringing instant coffee and going to a café. In Melboume, people going to café were 20% more than people bringing fresh coffee. The difference in Hobart was similar, which was approximately 15%.
Get the Weekly English Kit 📬
New words, one handy idiom, and a 2-minute quiz — delivered to your inbox to keep your streak alive.
 Related Questions