
Please help me with writing task 1
The information below gives details about household income and spending on food and clothes by an average family in one UK city in 2010 and 2013.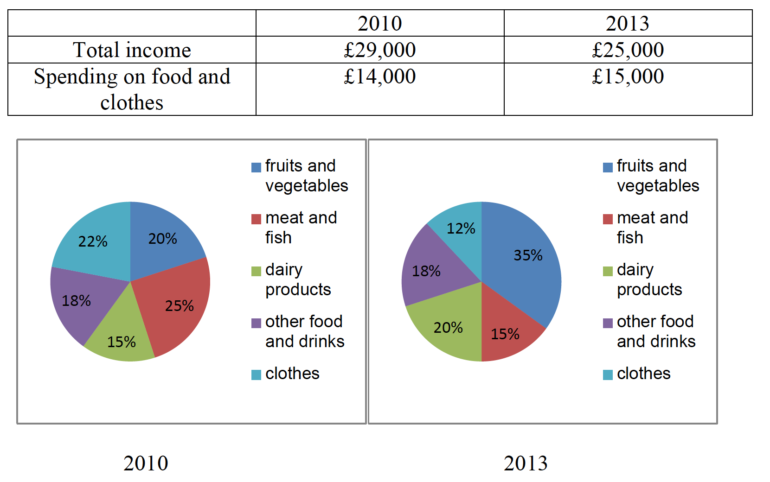
The charts given show data about household earnings and expenditure on food and clothes by an ordinary family in a UK city between 2010 and 2013.
Overall, while the family earned less in the second year, they spent more on food and clothes. The spending on clothes accounted for a small fraction in both years.
The total income of a family in the UK in 2010 was £ 29 000, just around half of which was expended on food and clothes. Three years later, while the total earnings decreased to 25 000, the expenditure on food and clothes rose to 15 000.
Of the total spending on food and clothes, 22% and 12% went to a garment in 2010 and 2013 respectively. Between 2010 and 2013, there was a rise of 15% spending on fruits and vegetables, was triple of the increase in expenditure on daily products declined 10% over three years. Additionally, the figure for other food and drinks remained stable during the three-year course.
Get the Weekly English Kit 📬
New words, one handy idiom, and a 2-minute quiz — delivered to your inbox to keep your streak alive.
 Related Questions