
Please help me with Writing Task 1?!!
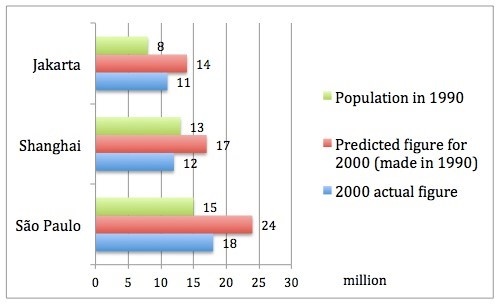
The bar chart demonstrates the projected and actual numbers of people in million in three different cities in 1990 and 2000.
As reflected in the chart, the predicted data of three cities was higher than the actual one during the time frame. Additionally, an upbeat trend was predicted to dominate in the population of these cities in 2000, likewise, the actual figure experienced a minor ascent with a noticeable exception of Shanghai.
São Paulo topped the chart in 1990 with 15 million people, nearly doubling the figure of Jakarta. Though forecast to rise by 9 million in the following year, this figure marginally swelled to 18 million, which was 6 million lower than predicted. Likewise, departing at a low of 8 million at the beginning of the period, Jakarta was projected to witness an approximately two-fold increase in 2000; however, only a three-million augmentation was seen in reality.
By contrast, the population of Shanghai was expected to accumulate by 4 million people (13 versus 17) between 1990 and 2000. Conversely, in fact, this figure ended the period by a drop to 12 million in 2000.
Top answer
Vocabulary for Task 1 - Avoid anthropomorphic verbs when describing data: see, witness, experience. Use these words for newspaper reports, stories, Task 2 essays, or historical accounts. They are not appropriate in a math / scientific context.
- Vocabulary for Task 1 - Avoid anthropomorphic verbs when describing data: see, witness, experience.
- Use these words for newspaper reports, stories, Task 2 essays, or historical accounts.
- They are not appropriate in a math / scientific context.
- The word "figure" is tricky.
- It is not used for general data points.
Get the Weekly English Kit 📬
New words, one handy idiom, and a 2-minute quiz — delivered to your inbox to keep your streak alive.
Vocabulary for Task 1 - Avoid anthropomorphic verbs when describing data: see, witness, experience. Use these words for newspaper reports, stories, Task 2 essays, or historical accounts. They are not appropriate in a math / scientific context.
The word "figure" is tricky. It is not used for general data points. It is used mostly in financial and business contexts. Try to
 Related Questions