
Please help me with this writing task 1. Thank you!!!
Hi! I'm preparing for my IELTS exam. Can you please review my report? Thank you so much!
The pie chart shows the information about how many house was owned and rented in the UK in 1991 and 2007. Overall, home owner and social renting were the most popular type of housing while private renting and social rent showed an opposite trend. However the number of houses was still rose significantly from 22 million in 1991 to 27 million in 2007.
As can be seen from the pie chart, people tend to own a house all the time and there was an domination of home owner from 60% in 1991 to 70% in 2007. Social renting was also popular but not much as home owner, the figure started to decrease slightly , with roughly 19% in 1991 to 13% in 2007.
In contrast, people were not attracted to private renting, the proportion of this figure had remained unchanged, account for 11% in 1991 and 2007. Social housing still remained the least popular type of housing from 10% to 6% between 1991 and 2007.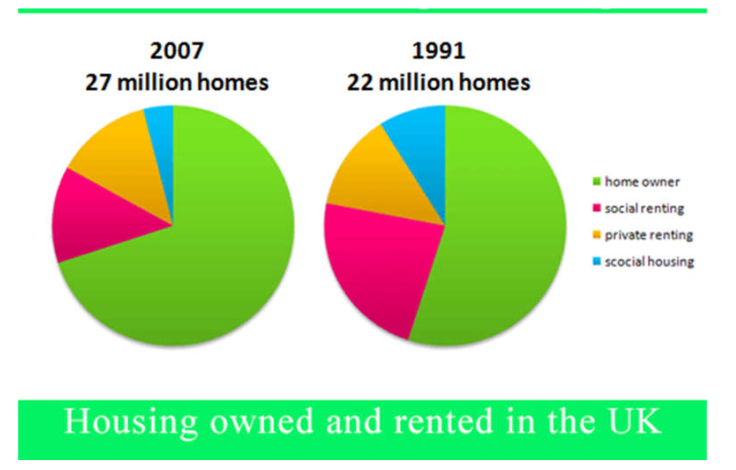
Top answer
Can you please post a picture of the chart? Click on: - Add comment - Attach images - Choose Files (upload the image) - Add to post
- Can you please post a picture of the chart?
- Click on: - Add comment - Attach images - Choose Files (upload the image) - Add to post
Get the Weekly English Kit 📬
New words, one handy idiom, and a 2-minute quiz — delivered to your inbox to keep your streak alive.
Can you please post a picture of the chart?
Click on:
- Add comment
- Attach images
- Choose Files (upload the image)
- Add to post
 Related Questions