
Please help me with this task 1 essay!! Many thankssss
Topic: The chart shows the sources of electricity produced in 4 countries between 2003 and 2008. Summarize the information by selecting and reporting the main features, and make comparisons where relevant.
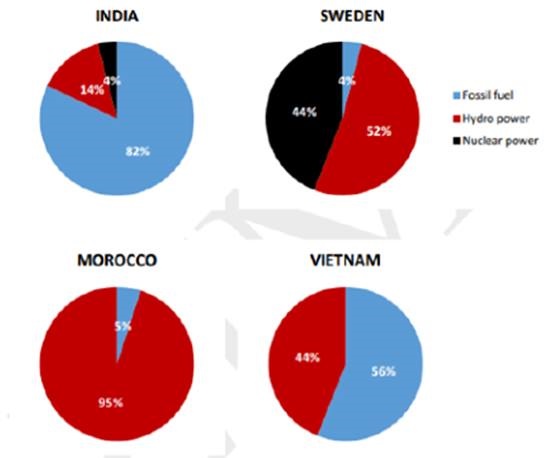
The given pie charts detail levels of using electricity from three different sources in four countries (India, Sweden, Morocco and Vietnam) from 2003 to 2008.
Taken as a whole, Vietnam and Morocco are the two countries which did not use any nuclear power for electricity production. In addition, the portions of electricity supplied from fossil fuel were the highest in India and Vietnam, while they were relatively marginal in Morocco and Sweden during the same examined period.
It is noticeable that 95% of total amount of electricity in Morocco came from hydro power, whereas, fossil fuel was the smallest source of electricity in this nation, accounting for just 5%. On the contrary, Vietnamese people use more electricity from fossil fuel than that from hydro power, at 56% and 44% respectively.
In Sweden, nuclear power occupied a rather large proportion in producing electricity, at 44%. However, this was not the same for the figures for India, just 4% of electricity from nuclear power was used. Meanwhile, 82% of electricity in this country was from fossil fuel, compared to only 4% of the similar source in Sweden.
Top answer
The given pie charts detail levels of using (wrong usage. show a breakdown of the amounts of electricity generated per source ... ) electricity from three different sources in four countries (India, Sweden, Morocco and Vietnam) from 2003 to 2008.
- The given pie charts detail levels of using (wrong usage.
- show a breakdown of the amounts of electricity generated per source ...
- ) electricity from three different sources in four countries (India, Sweden, Morocco and Vietnam) from 2003 to 2008.
- Taken as a whole , Vietnam and Morocco are the two countries which did not use any nuclear power for electricity production.
- ) from fossil fuel were the highest in India and Vietnam, while they were relatively marginal in Morocco and Sweden during the same examined period.
Get the Weekly English Kit 📬
New words, one handy idiom, and a 2-minute quiz — delivered to your inbox to keep your streak alive.
The given pie charts detail levels of using (wrong usage. show a breakdown of the amounts of electricity generated per source ... ) electricity from three different sources in four countries (India, Sweden, Morocco and Vietnam) from 2003 to 2008.
Taken as a whole, Vietnam and Morocco are the two countries whic
Fanru
the given chart compares weight fluctuation of different age group of people of Charlestown in year 2015 and 1995.five catogeries of weight are mentioned along with four weight groups under weight, ideal overweigh and obese.
Overall this chart reflect that people of Charlestown were more healthy in 1995 all age groups lie in healthy weight catog
 Related Questions