
Please help me with this pie chart
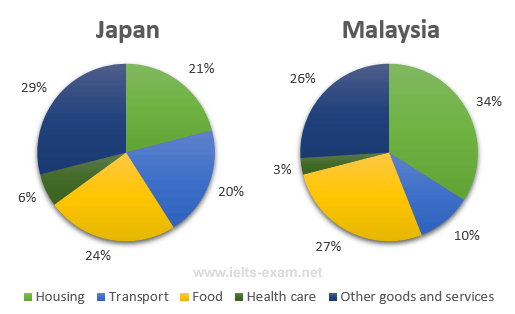
The pie charts below show the average household expenditures in Japan and Malaysia in the year 2010.
Summarise the information by selecting and reporting the main features, and make comparisons where relevant.
The pie chart depicts how much money an average family in Japan and Malaysia spent on different categories in the year 2010. It is immediately apparent that the Japanese spent most on other goods and services while in Malaysia, housing headed the list.
In Japan, other goods and services occupied much the greatest proportion of expenditure at 29%, followed by food at 24% while the least popular was health care accounted for only 6%. There is only a 1% difference between the figures for housing and transport in third to fourth places in terms of spending respectively
In Malaysia, the spending on housing was the most popular at 34% while that of health care was only 3% of the total expenditure. Spending on other goods and services and food was equally popular at 26% and 27% in turn. In addition, the number of money that an average family spent on transport was 10%.
Top answer
The pie char ts provide depicts how much money an a breakdown (based on five categories) of the expenditure of average famil ies in Japan and Malaysia spent on different categories in the year 2010. It is immediately apparent that the for Japanese households, spent most on other goods and services represented the largest category, while in Malaysia, housing headed the list. In Japan, other goods and services occupied much the greatest proportion represented 29% of expenditu re, at 29%, followed by food at 24 %, while the least popular was health care accounted for only 6%.
- The pie char ts provide depicts how much money an a breakdown (based on five categories) of the expenditure of average famil ies in Japan and Malaysia spent on different categories in the year 2010.
- It is immediately apparent that the for Japanese households, spent most on other goods and services represented the largest category, while in Malaysia, housing headed the list.
- In Japan, other goods and services occupied much the greatest proportion represented 29% of expenditu re, at 29%, followed by food at 24 %, while the least popular was health care accounted for only 6%.
- There is was only a 1% difference between the figures for housing (21%) and transport (20%) in third to fourth places in Japan.
- terms of spending respectively In Malaysia, the spending on housing was the most popular largest category at 3 4%, while that of health care was only 3% of the total expenditure.
Get the Weekly English Kit 📬
New words, one handy idiom, and a 2-minute quiz — delivered to your inbox to keep your streak alive.
The pie charts provide depicts how much money an a breakdown (based on five categories) of the expenditure of average families in Japan and Malaysia spent on different categories in the year 2010. It is immediately apparent that the for Japanese households, spent most on other goods and services represented the l
 Related Questions