
Please help me with this: IELTS writing task 1 - line graph
The line graph illustrates the differences between the using of 3 types of spreads including margarine, butter and low fat and reduced spreads during 1981 and 2007.
Overall, as can be seen from the chart, there were downward trends in margarine and butter’s uses, whereas a fluctuation was observed from that of the other one in the period shown.
In particular, increasing slightly from 140 grams in 1981 to 160 grams in 1986, the quantity of butter used decreased remarkably to approximately 50 grams over the last years of the period.
By comparison, after a moderate fluctuation in the first 5 years, that of margarine climbed up to reach a peak of 100 grams in 1991 and remained stable there until 1996, however, in the last 21 years, it declined significantly by 60 grams
Different from the consumption of the 2 spreads mentioned above, that of low fat and reduce spreads, which only appeared in 1996, surged from about 10 grams at the beginning to around 90 grams in 2001 and tended to go down average reaching a point of about 70 grams to end the period.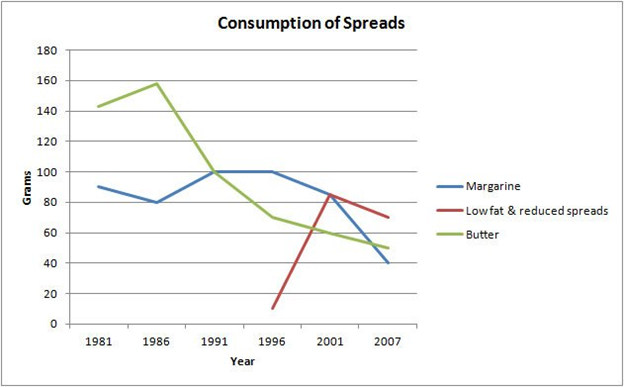
Top answer
The line graph illustrates compares the differences between the using rates of consumption of three types of spread s: including margarine, butter and lo w-f at / reduced -f at and reduced spreads during between 1981 and 2007. Overall, as can be seen from the chart, there the trends were downward trends in for margarine and butte r, ’s uses, whereas the rate for the third type of spread was the shape of an inverted V. a fluctuation was observed from that of the other one in the period shown.
- The line graph illustrates compares the differences between the using rates of consumption of three types of spread s: including margarine, butter and lo w-f at / reduced -f at and reduced spreads during between 1981 and 2007.
- Overall, as can be seen from the chart, there the trends were downward trends in for margarine and butte r, ’s uses, whereas the rate for the third type of spread was the shape of an inverted V.
- a fluctuation was observed from that of the other one in the period shown.
- In particular, increasing slightly from 140 grams in 1981 to 160 grams in 1986, the quantity of butter used decreased remarkably to approximately 50 grams over the last years of the period.
- By comparison, after a moderate fluctuation in the first 5 years, that the consumption of margarine climbed up to reach a peak of 100 grams in 1991 and remained stable there until 199 6.
Get the Weekly English Kit 📬
New words, one handy idiom, and a 2-minute quiz — delivered to your inbox to keep your streak alive.
The line graph illustrates compares the differences between the using rates of consumption of three types of spreads: including margarine, butter and low-f
 Related Questions