
Please help me with this IELTS writing - Student enrolment
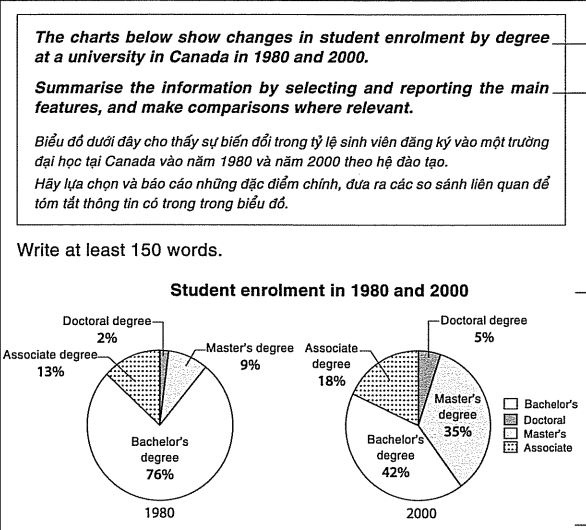
The graphs make comparisons of student enrolment percentage in some types of degrees between 1980 and 2000.
Overall, most students preferred having bachelor’s degrees in both surveyed years, although the percentage varied significantly. Also noticeable is that master’s degree enrolment had remarkably soared over those years.
Looking closer at the graphs, over three-quarters of the students surveyed in 1980 chose to enroll in their bachelor’s degree programs, substantially higher than the other degrees. This type of degree remained the most chosen one in 2000, but its proportion dropped, ending up at 42%. That was slightly higher than the second most preferred one, the master’s degree, which had soared remarkably over the years, going from only 9% in 1980, to 35% in 2000.
As for the other degrees, Associate and Doctoral, they had also increased, but not as noticeable. The former one gained 5%, ending up at 18%, and lost its second favorite position. The latter one experienced a tiny 3% increase over those years, reaching only 5% in 2000.
Top answer
The [ 1 ] two pie charts graphs make comparisons of compare student enrolment percentage in some four types of degrees [ 2 ] in one Canadian university between 1980 and 2000. Overall, [ 3 ] most students preferred having bachelor’s degrees in both surveyed years represented the largest sectors , although the percentage fell in 2000. varied significantly .
- The [ 1 ] two pie charts graphs make comparisons of compare student enrolment percentage in some four types of degrees [ 2 ] in one Canadian university between 1980 and 2000.
- Overall, [ 3 ] most students preferred having bachelor’s degrees in both surveyed years represented the largest sectors , although the percentage fell in 2000.
- varied significantly .
- Also noticeable is that master’s degree enrolment s had remarkably soared over those years.
- Looking [ 4 ] closer at the graphs, O ver three-quarters of the students surveyed in 1980 [ 3 ] chose to enroll were in their bachelor’s degree programs, substantially higher than the percentage of those in other degrees.
Get the Weekly English Kit 📬
New words, one handy idiom, and a 2-minute quiz — delivered to your inbox to keep your streak alive.
The [ 1] two pie charts graphs make comparisons of compare student enrolment percentage in some four types of degrees [ 2
 Related Questions