
Please help me with this essay: Task 1 CO2 emissions
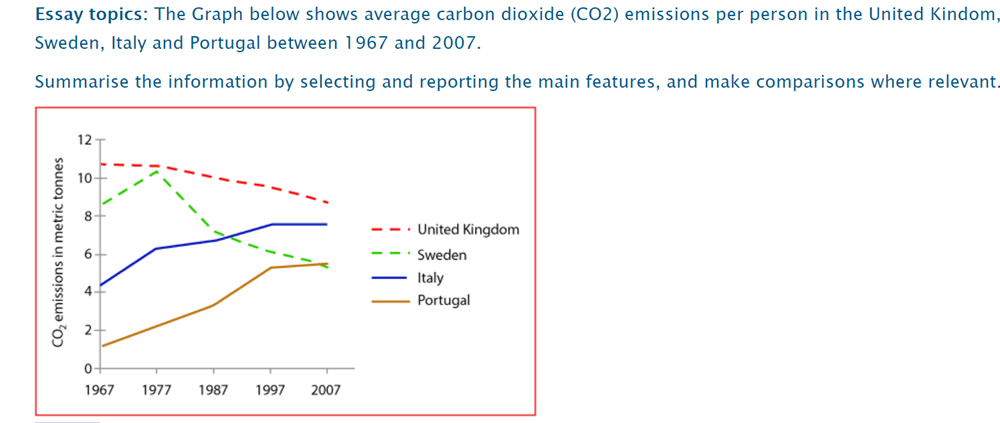
The graph gives information about the amount of carbon dioxide a person produced in 4 countries: the United Kingdom, Sweden, Italy and Portugal from 1967 to 2007.
Overall, the average C02 emissions per person in the UK and Sweden went down in the period of 40 years, meanwhile that of Italy and Portugal went up.
As can be seen from the graph, each Swedish person produced roughly at 8.5 tonnes of CO2 in 1967 while a British person emitted 11 tonnes. After that, the average carbon emissions in Sweden rose significantly and hit its peak at approximately 11 in 1977. The period from 1977 onwards witnessed a sharp decline in CO2 emissions in both Sweden and England. The amount of CO2 in the UK gradually to 9 in 2007, while that of Sweden almost halved at around 5 in the same year.
Looking at the graph, Italy’s average CO2 started at over 4 tonnes which was twice as much as that amount of Portugal in 1967. Both countries Italy and Portugal experienced a dramatic rise in the carbon dioxide emissions to nearly 8 and 5 tonnes respectively in 2007.
Top answer
) graph gives information about the amount of carbon dioxide a person produced in 4 countries: (This says that there was one person who produced CO 2 . ) the United Kingdom, Sweden, Italy and Portugal from 1967 to 2007. Overall, the average C02 emissions per person in the UK and Sweden went down in the period of 40 years , meanwhile while those that of Italy and Portugal went up.
- ) graph gives information about the amount of carbon dioxide a person produced in 4 countries: (This says that there was one person who produced CO 2 .
- ) the United Kingdom, Sweden, Italy and Portugal from 1967 to 2007.
- Overall, the average C02 emissions per person in the UK and Sweden went down in the period of 40 years , meanwhile while those that of Italy and Portugal went up.
- ) emitted 11 tonnes.
- ) the average carbon emissions in Sweden rose significantly and hit its peak at approximately 11 in 1977.
Get the Weekly English Kit 📬
New words, one handy idiom, and a 2-minute quiz — delivered to your inbox to keep your streak alive.
The (what kind of graph?) graph gives information about the amount of carbon dioxide a person produced in 4 countries: (This says that there was one person who produced CO2. This person went to four countries during that time to produce CO2.) the United Kingdom, Sweden, Italy and Portugal from 1967 to 2007.
 Related Questions