
Please help me with this essay
The line graph below shows the percentage of tourists to Scotland who visited four different attractions in Edinburgh. Summarize the information by selecting and reporting the main features, and make comparisons where relevant.
Write at least 150 words
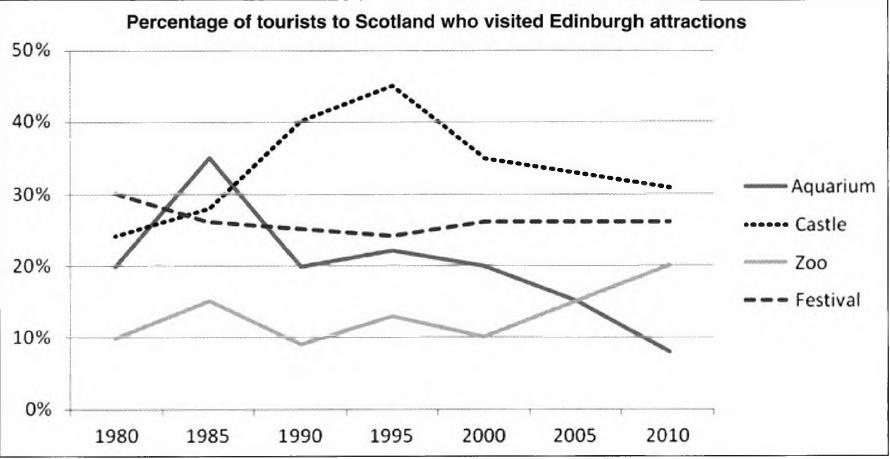
The line graph gives the information about the percentage of tourists to Scotland who visited Edinburgh attractions including aquarium, castle, zoo, festival from 1980 to 2010. We can see that the least popular attraction in 1980 was the zoo but in 2010 the aquarium was the least popular because of the change. The castle and the festival were the favorite attractions in both 1980 and 2010.
During the period from 1980 to 1995 there was a sharp rise in the number of tourists to the castle from 25% to 45% and then it decreased steadily to 30% in 2010. The trend of the aquarium also was similar to the castle, there was a rapid increase from 20% to 35% in 5 years from 1980 and then it went down gradually to less than 10% at the end. The percentage of visitors who visited festival fluctuated slightly but it remained stable at about 25% after 2000. Visitors to the zoo also fluctuated between 10% and 15% then after 2000 increased rapidly at 20% in 2010.
Top answer
The line graph gives the information about (Wrong. It plots these percentages. ) the percentage of tourists to Scotland who visited four Edinburgh attractions ( including the aquarium, castle, zoo, (missing word) festival ) from 1980 to 2010.
- The line graph gives the information about (Wrong.
- It plots these percentages.
- ) the percentage of tourists to Scotland who visited four Edinburgh attractions ( including the aquarium, castle, zoo, (missing word) festival ) from 1980 to 2010.
- We can see that the least popular attraction in 1980 was the zoo but in 2010 the aquarium was the least popular because of the change.
- The castle and the festival were the favorite attractions in both 1980 and 2010.
Get the Weekly English Kit 📬
New words, one handy idiom, and a 2-minute quiz — delivered to your inbox to keep your streak alive.
The line graph gives the information about (Wrong. It plots these percentages. It does not give information about them.) the percentage of tourists to Scotland who visited four Edinburgh attractions ( including th
 Related Questions