
Please help me with this essay
The bar chart below shows the number of students who chose certain university subjects in 2005. Summarize the information by selecting and reporting the main features, and make comparisons where relevant.
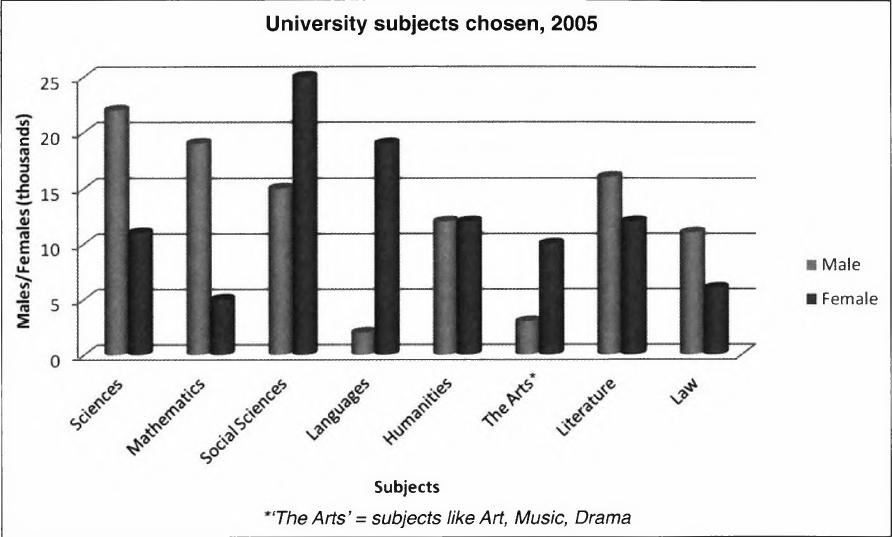
The bar chart illustrates the numbers (in thousands) of students who enrolled different subjects at the university in 2005. There are eight subjects including sciences, mathematics, social sciences, languages, humanities, arts, literature, law and each subject is divided into males and females.
Science and math are the most popular for men whereas non-science subjects are more common to women. Female students are likely to study less technical subjects such as social sciences, languages, and literature. In contrast, male students are likely to enroll for logical subjects such as sciences, mathematics, law and literature (which is an exception). The numbers of men who study languages and the arts are very small only two thousands and three thousands. Likewise, the numbers of women are also small in mathematics by nearly five thousands and in law by over five thousands. However, there is interesting that humanity courses have as many males as females by over ten thousands.
Thank you.
Get the Weekly English Kit 📬
New words, one handy idiom, and a 2-minute quiz — delivered to your inbox to keep your streak alive.
 Related Questions