
Please help me with the report
The table below describes percentages of home schooled students in Some Country in 1999-2004. Write a report for a university lecturer describing the information shown.
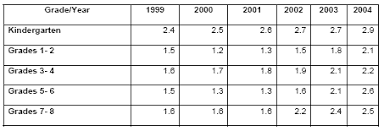
The table compares different categories of education system in terms of the proportion of home schooled students in several nations in a six-year period, from 1999 to 2004.
Overall, the most striking feature is that there were upward trends in the percentage of students studying at home in all school levels over the period given . Another interesting point is that kindergarten had the largest percentage of home schooled students in all six years, while the lowest one came from grades 1-2.
Looking at the details, it is clear that in 1999 (the first year of the period) , the percentage of kindergarten’s home schooled children was 2.4%, while the figures for the next two levels namely grades 1-2 and grades 3-4 were significantly lower, at 1.5 and 1.6 each. Following that, the year 2004 witnessed steady climbs in these figures, at 2.9, 2.1 and 2.2 respectively.
As regards the two remaining levels, between 1999 and 2004, there was a substantial rise in the percentage of home schooled students in grades 5-6, soaring from 1.6% to 2.5%. Meanwhile, the pattern for the oldest grade shown was relatively the same, with a figure growing from 1.6% to 2.5%, despite a marginal drop of 0.2%, down to 1.6% in 2001
Get the Weekly English Kit 📬
New words, one handy idiom, and a 2-minute quiz — delivered to your inbox to keep your streak alive.
 Related Questions