
Please help me with the bar chart-writing task 1
The Bart chart depicts a general amount of time, measured in billions, people used for making their telephone calls in the UK separated into three different types(local-fixed line, international-fixed line and all mobile calls) between 1995 and 2002
Overall, it’s evident that there was a considerable increase in time used to make for both national and international calls and mobiles over the period shown, whilst the total number of minutes used mostly for local calls remained stable for 7 years.
In 1995, the figure consumed for local calls stood at about 73 billions before there was a slight increase yearly until it reached a peak of 90% in 1999. However, from 1999 onward, this one declined gradually and came back the first number, over 70% in 2002.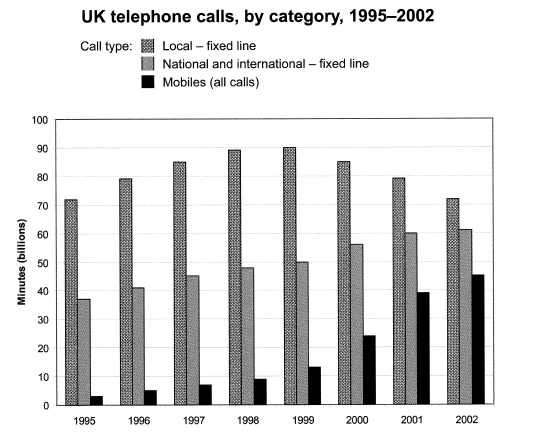
By contrast, there were annual increases in time consumed both for national and international calls and for mobiles in 2002, at 60 billions and 45 billions respectively after the total number of minutes of national and international calls started at about 38 billions in 1995 while it could be seen the lowest number of mobiles consumed, at only 3% at the same time.
Top answer
Do you still need help with that?
- Do you still need help with that?
Get the Weekly English Kit 📬
New words, one handy idiom, and a 2-minute quiz — delivered to your inbox to keep your streak alive.
Read my advice for Task 1 essays.
https://www.englishforums.com/English/IeltsTaskHintsTipsAdvice/bxgnkx/post.htm
You tend to write sentences that are too long and confusing for the reader.
The
 Related Questions