
Please help me with task 1 IELTS
The graph below shows the quantities of goods transported in the UK between 1974 and 2002 by four different modes of transport.
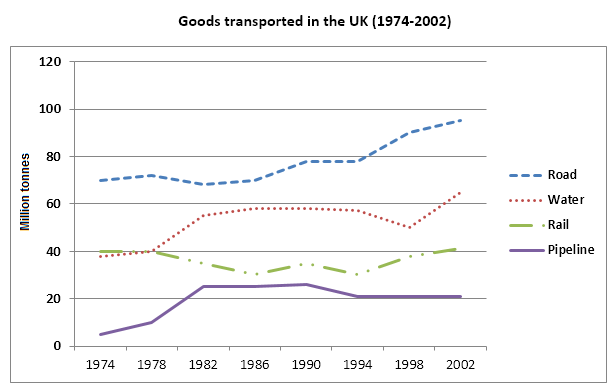
The line graph illustrates how much cargo was carried in the UK by four distinctive means of transport from 1974 to 2002. Units are measured in million tonnes. Overall, it can be clearly seen that all the targeted modes underwent some fluctuations during the given time, with road vehicles being the prevalent means of goods transportation.
To commence with, the most considerable amount of transported cargo was recorded for road over the documented span of time. Specifically, starting at about 70 million tonnes in 1974, the figure slightly fluctated during the next 20 years. After that time, there was a sharp increase with the number reaching its peak of nearly 100 million tonnes by 2002.
Conversely, pipeline was the last method people would resort to for carrying goods. In 1974, a mere 4 million tonnes of cargo was carried by pipeline. However, the figure then gradually rose until achieving the highest point of over 20 million tonnes in 1995, after which time it reached a plateau and remained stable.
For the two remaining means, although commencing at the same point of around 40 million tonnes in 1974, ships and boats witnessed a considerable rise in the number of carried cargo and became the second popular choice of transport modes. Meanwhile, after experiencing several fluctuations, the figure for trains returned to its beginning point with 40 million tonnes by the end of the period.
Top answer
The line graph illustrates how much cargo (Not a good synonym) was carried in the UK by four distinctive (wrong word. - distinct) means of transport from 1974 to 2002. Units are measured in million tonnes.
- The line graph illustrates how much cargo (Not a good synonym) was carried in the UK by four distinctive (wrong word.
- - distinct) means of transport from 1974 to 2002.
- Units are measured in million tonnes.
- Overall, it can be clearly seen that (This is an opinion.
- ) modes underwent some fluctuations (The mode of transportation did not change.
Get the Weekly English Kit 📬
New words, one handy idiom, and a 2-minute quiz — delivered to your inbox to keep your streak alive.
The line graph illustrates how much cargo (Not a good synonym) was carried in the UK by four distinctive (wrong word. - distinct) means of transport from 1974 to 2002. Units are measured in million tonnes. Overall, it can be clearly seen that (This is an opinion. In Task 1,
 Related Questions