
Please Help Me With Task 1
I would never get tired of thanking the people in this forum.
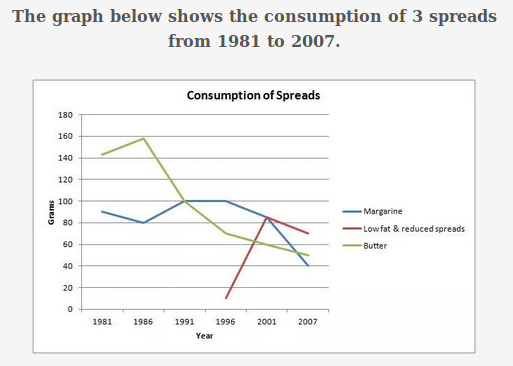
The line graph depicts the amount of Margarine, Butter and Low fat and reduced spreads consumed between 1981 and 2007. Units are measured in grams.
Overall, the most popular spread among the three was butter, initially, but it was replaced by low fat and reduced spreads in the latter years. Although both butter and margarine had a downward trend, low fat and reduced spreads showed an upward trend.
About 140 grams of butter were consumed in 1981. It rose to 160 grams over the next five years, before falling dramatically to approximately 50 grams in 2007. On the other hand, low fat and reduced spreads were unavailable in the market until the year 1996, when the amount consumed was 10 grams. It increased by almost nine times to 90 grams in 2001. However, it dropped slightly by 20 grams to 70 grams in 2007.
Regarding the amount of margarine consumption, it varied within the range of 80 grams to 100 grams between 1981 and 2001; then, it declined by almost 50% to 40 grams in the final year.
Top answer
There is one major flaw in your otherwise excellent essay. The line graph depicts the amount of Margarine, Butter and Low fat and reduced spreads consumed between 1981 and 2007. Units are measured in grams.
- There is one major flaw in your otherwise excellent essay.
- The line graph depicts the amount of Margarine, Butter and Low fat and reduced spreads consumed between 1981 and 2007.
- Units are measured in grams.
- (Not correct.
- What you have written is the total consumption of these products - for example 10 billion grams.
Get the Weekly English Kit 📬
New words, one handy idiom, and a 2-minute quiz — delivered to your inbox to keep your streak alive.
There is one major flaw in your otherwise excellent essay.
The line graph depicts the amount of Margarine, Butter and Low fat and reduced spreads consumed between 1981 and 2007. Units are measured in grams. (Not correct. What you have written is the total consumption of these products - for example 10 billion grams. It is
 Related Questions