
Please help me with Task 1
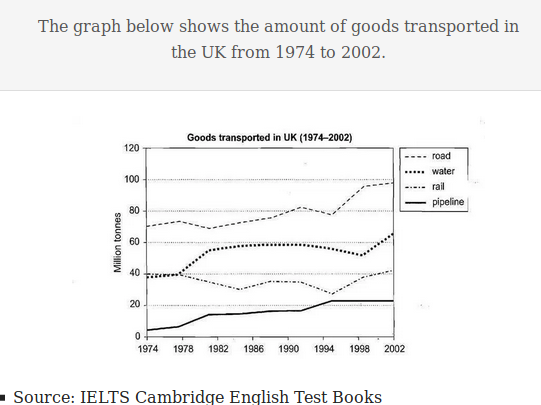
The line graph provides information about the four main ways (road, water, rail and pipeline) products were shipped in the UK between 1974 and 2002. Units are measured in million tonnes
Overall, most of the goods were transported in the UK through roads throughout the period shown. Although the use of rail in order to transport products varied, road, water and pipeline increased.
In 1974, about 70 million tonnes of goods were transported via roads. It steadily increased and reached its highest level in 2002 with almost 100 million tonnes. The same pattern was seen in goods being transported through pipelines. It started with approximately 5 million tonnes and then went up to 21 million in 1994. It remained steady up to 2002. Meanwhile, less than 40 million tonnes of products were shipped via water in 1974. It climbed to around 55 million in 1982, and this amount stayed the same up to 1991, before falling slightly to 50 million in 1998. After which, it rose to 65 million in the final year.
Regarding products transferred using railways, the amount was at exactly 40 million tonnes in 1974, and it did not change for the next four years. It fluctuated around 35 million between 1978 and 1995, before increasing to over 41 million in 2002.
Top answer
The line graph provides information (Imprecise - tell the reader what is plotted on the graph. ) about the four main ways (road, water, rail and pipeline) by which products were shipped in the UK between 1974 and 2002. Units are measured in million tonnes (incorrect usage, missing punctuation) Model paragraph: The line graph plots the volume by weight (in millions of tonnes) of goods shipped within the UK for each of four methods of transport.
- The line graph provides information (Imprecise - tell the reader what is plotted on the graph.
- ) about the four main ways (road, water, rail and pipeline) by which products were shipped in the UK between 1974 and 2002.
- Units are measured in million tonnes (incorrect usage, missing punctuation) Model paragraph: The line graph plots the volume by weight (in millions of tonnes) of goods shipped within the UK for each of four methods of transport.
- from 1974 to 2002.
- The four methods are road, water, rail and pipeline.
Get the Weekly English Kit 📬
New words, one handy idiom, and a 2-minute quiz — delivered to your inbox to keep your streak alive.
The line graph provides information (Imprecise - tell the reader what is plotted on the graph. ) about the four main ways (road, water, rail and pipeline) by which products were shipped in the UK between 1974 and 2002. Units are measured in millio
 Related Questions