
PLEASE HELP ME WITH TASK 1
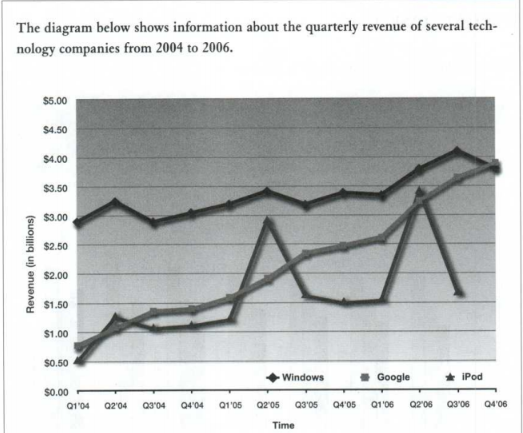
The given graph indicates the changes in the amount of revenue per quarter of three technology corporations between 2004 and 2006.
Generally, all of the figures experienced a significant increase in which Windows made up of the majority in sales whereas Google showed the speediest growth during the timescale.
In the first quarter of 2004, the revenue of Windows was just below 3 billion, which was six-fold and nearly five-fold that of iPod and Google respectively. From 2004 to the second quarter of 2005, there was a slight growth by 0.5 and 1.15 billion in Windows and Google, respectively. Yet, iPod made a dramatical climb that it overtook Google twice, once was in the second quarter of 2004 with around 1 billion and the other was in the first quarter of 2005 with just over 1.5 billion.
However, iPod revenue suddenly dropped to 1.5 billion within the next three quarters, leading to the overtake of Google with a gradual growth from 2.25 to 3.25 billion. This volume continued to decrease to 1.65 in the last quarter of 2006 after jumping back to a peak of 3.5 in the second quarter. In contrast, while Windows gradually climbed to its peak at 4 billion, it then was surpassed by Google at the point of 3.9 billion in the last quarter of 2006.
(231 words)
Top answer
) graph indicates the changes in the amount of revenue per quarter of three technology corporations between 2004 and 2006. (There is no corporation called "iPod" company. ) Generally, all of the figures companies had experienced a significant increase in which Windows made up of the majority in sales (poor English.
- ) graph indicates the changes in the amount of revenue per quarter of three technology corporations between 2004 and 2006.
- (There is no corporation called "iPod" company.
- ) Generally, all of the figures companies had experienced a significant increase in which Windows made up of the majority in sales (poor English.
- This makes no sense) whereas Google showed the highest s peediest growth during the timescale .
- (wrong word - period) In the first quarter of 2004, the revenue of Windows was just below 3 billion, which was about six times that of iPod and five times that of iPod.
Get the Weekly English Kit 📬
New words, one handy idiom, and a 2-minute quiz — delivered to your inbox to keep your streak alive.
The given (What kind of graph?) graph indicates the changes in the amount of revenue per quarter of three technology corporations between 2004 and 2006. (There is no corporation called "iPod" company. The graph is very suspect.)
Generally, all of the figures companies had experienced a
 Related Questions