
Please help me with my writing task 1, thank you
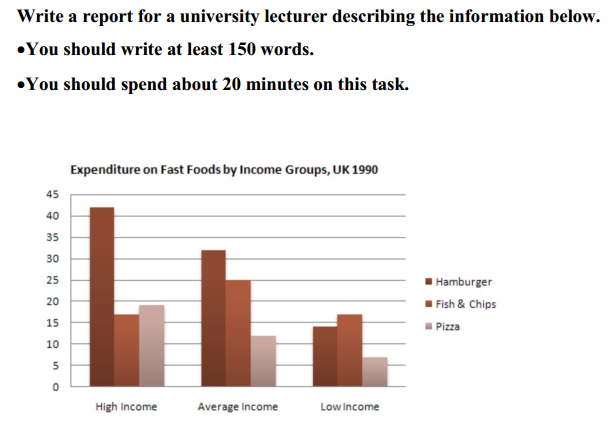
The bar chart compares three income groups in terms of 3 different types of fast food in UK in 1990.
Overall, it is noticeable that there were differences in each of the food eaten. Also, the low income group spent the lowest amount
People in high income group spent their income more on hamburger, at 42 pence a week, compared to 17 pence on fish and chips and 19 pence on pizza. In the average income group, they also spent more on hamburger, at 32 pence a week. Although their spending on hamburger was lower than the high income group, their expenditure on fish and chips was higher, at 25 pence a week. Their spending on pizza accounted for the lowest figure, which was only 12 pence.
By contrast, people spent more on fish and chips in the low income group, at 16 pence per week. However, their spending on hamburger and pizza were much lower, at 14 and 6 pence respectively.
Top answer
Please post essays, paragraphs, dialogues and other writing in the essay forum so a moderator does not have to move your post. Click on this link: Next, tap on the green button "write a new post" Please read my advice for Task 1 essays: IELTS TASK 1: Hints, Tips And Advice Vocabulary Words For Task 1: Reference Post
- Please post essays, paragraphs, dialogues and other writing in the essay forum so a moderator does not have to move your post.
- Click on this link: Next, tap on the green button "write a new post" Please read my advice for Task 1 essays: IELTS TASK 1: Hints, Tips And Advice Vocabulary Words For Task 1: Reference Post
Get the Weekly English Kit 📬
New words, one handy idiom, and a 2-minute quiz — delivered to your inbox to keep your streak alive.
First of all, this task is flawed. There is no indication of the units on the Y-Axis in the instructions. Some publications of this task give millions of pounds sterling for one year, 1990; others give average pence per week per person. So you must make your best guess and put that assumption in the first paragraph.
The bar chart compares three income groups in terms of
 Related Questions