
Please Help Me With My Writing Task 1: bar graph [recent actual test]
Note: This is the actual prompt in a recent IELTS exam in my area. It seems to me that it was not that hard at first, but it turned out to be a really difficult question when I started doing it. I am so grateful if someone could give me advice and a sample of writing if possible.
Task 1: The bar chart shows the types of media that people of different age groups used to get daily news in one country in 2011. Summarize the information by selecting and reporting the main features, and make comparisons where relevant.
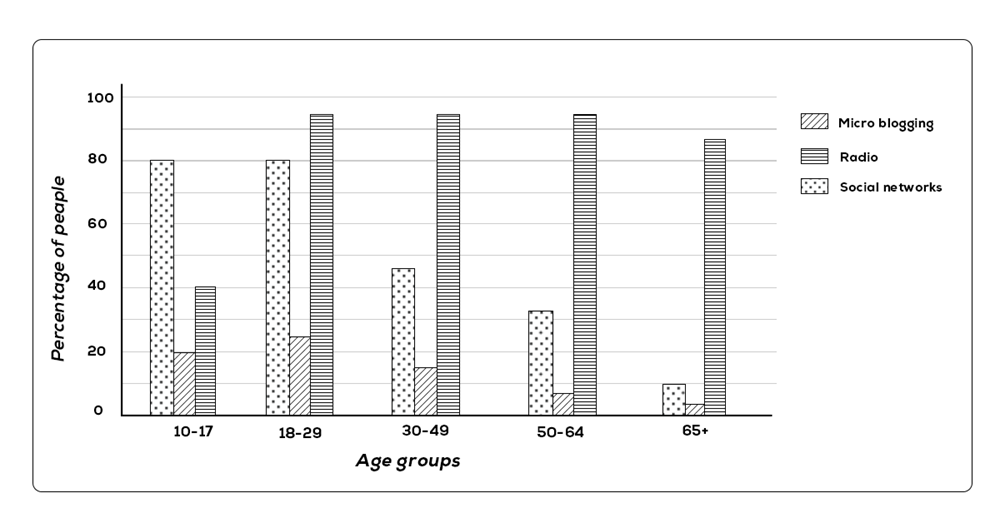
The chart compares the percentage of individuals of five various age groups in terms of three media types used for reading daily news in a specific nation in 2011.
Overall, apart from people who were 10-17, radio was the most popular media for getting everyday news among all age groups. Additionally, 18-29-year-olds were generally more likely to use media channels to read daily news more than other groups.
For three groups of people aged 18-29, 30-49, and 50-64, the percentages of those using radio to get news were almost equal and highest, at 93%, while the proportions for social network users were significantly lower, at approximately 80%, 45%, and 32%, respectively. Meanwhile, individuals who read news via micro blogging accounted for the lowest proportions, at around only 25%, 15%, and 8%, respectively.
For news readers who were 10-17 and more than 65, the percentage of people in the higher age using radio was highest, at 82%, compared to roughly 40% for the lower age group. At the same time, social network and micro blogging users who were younger made up 80% and 10% of these groups respectively, while the percentages for older people were only 10% and 5%.
(198 words)
Top answer
tk2004 The chart What kind of chart?
- tk2004 The chart What kind of chart?
Get the Weekly English Kit 📬
New words, one handy idiom, and a 2-minute quiz — delivered to your inbox to keep your streak alive.
tk2004 five various age groups
What are the ages of the groups?
Sample essay
In 2011 in one nation, people were asked if they used one or more of the following sources to get their daily news: bloggers, radio and social networks. The bar chart plots the percentages of respondents grouped into five age ranges: children 10-17, young adults 18-29, adults 30-49, older adults 50-64 and seniors 65 and older.
Overall, people used all
 Related Questions