
Please Help Me With My Writing Task 1: bar graph
The bar chart shows the percentage of the small, medium, large companies which used social media for business purposes between 2012 to 2016.
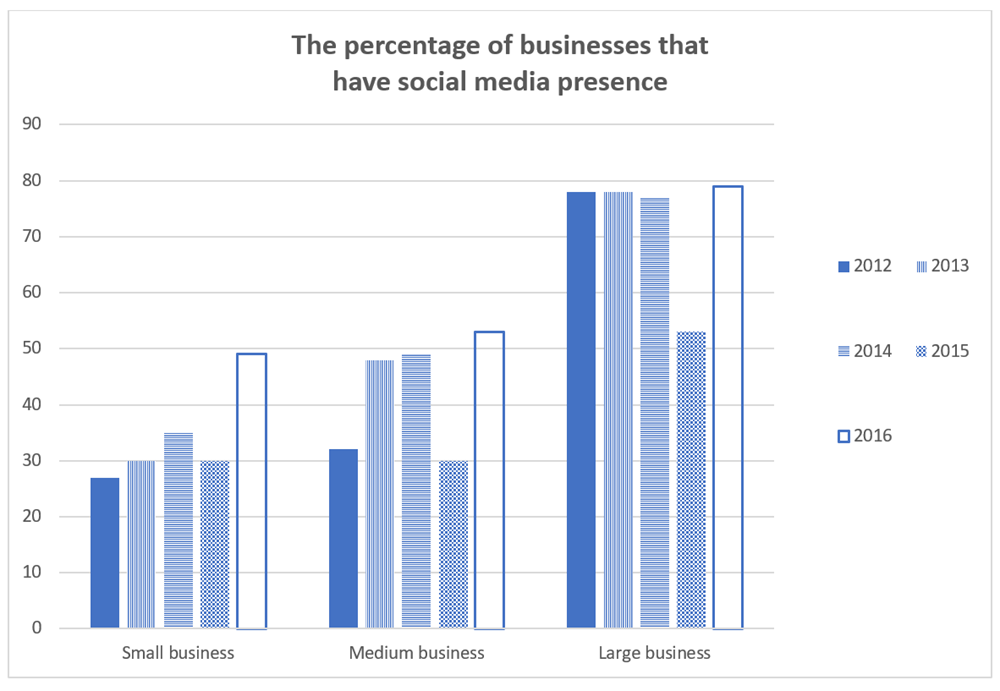
The chart compares the proportion of three categories of companies by business size which employed social media for business ends from 2012 to 2016.
Overall, there is a tendency that the larger the size of business, the higher the percentage of companies having social media presence. Additionally, the figure for large businesses present in social media was by far highest during the period.
In 2012, the proportion of large companies having social media presence was highest, at around 78% of the total large businesses, while the figure for small companies was lowest, at only 26%. Meanwhile, approximately 32% of medium companies were present in social media. In 2015, the percentages of large and medium firms employing social media for commercial ends declined sharply and reached the lowest points at about 52% and 30%, respectively, while the figure for small firms slightly decreased.
In 2016, the proportion of large businesses present in social media dramatically rose and remained the highest figure in the chart. Similarly, there were rapid increases in the percentage of medium and small businesses to around 52% and 49%, respectively.
(182 words)
Get the Weekly English Kit 📬
New words, one handy idiom, and a 2-minute quiz — delivered to your inbox to keep your streak alive.
 Related Questions