
Please help me with my writing task 1.
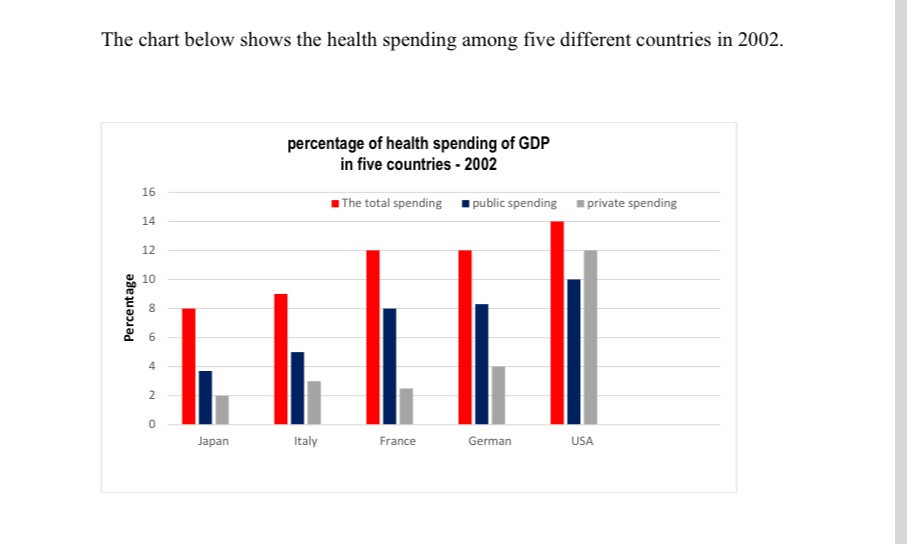
The bar chart compares the percentage of health expenditure of GDP in five different countries (Japan, Italy, France, German and USA) in 2002. Three sectors shown: the total spending, the public spending and the private spending.
Overall, the public spending was higher than the private one in all of these countries except for USA. Of all five countries, Japan spent on all three of sectors the least, whereas the percentage of health spending in USA was the highest.
In detail, for the total spending, USA spent 14% of GDP on health while only 8% of GDP in Japan was allocated on that. The percentage of GDP in the total spending in France was equal that of German, at 12%, which was in second place. With regards to two remaining sectors, USA was the only one in which the private spending surpassed the public spending, 12% versus 10%. France had the biggest gap between the public spending and the private spending. Although the proportion of GDP in public spending in France was approximate to that of German, France spent less in private spending than German, a nearly 2% difference. In Japan, both public spending and private spending were the lowest, only just under 4% and 2% respectively.
Top answer
The bar chart compares the percentage of health expenditure of GDP (GDP is "Gross Domestic Product". It is all the production in the entire economy. That is the basis upon which this percentage is calculated.
- The bar chart compares the percentage of health expenditure of GDP (GDP is "Gross Domestic Product".
- It is all the production in the entire economy.
- That is the basis upon which this percentage is calculated.
- ) on healthcare in five different countries (Japan, Italy, France, German and USA) in 2002.
- Three sectors (Wrong word.
Get the Weekly English Kit 📬
New words, one handy idiom, and a 2-minute quiz — delivered to your inbox to keep your streak alive.
The bar chart compares the percentage of health expenditure of GDP (GDP is "Gross Domestic Product". It is all the production in the entire economy. That is the basis upon which this percentage is calculated. "Health expenditure of GDP" makes no sense.) on healthcare in five different countries (Japan, Italy, France, German and USA)
 Related Questions