
Please help me with my writing task 1
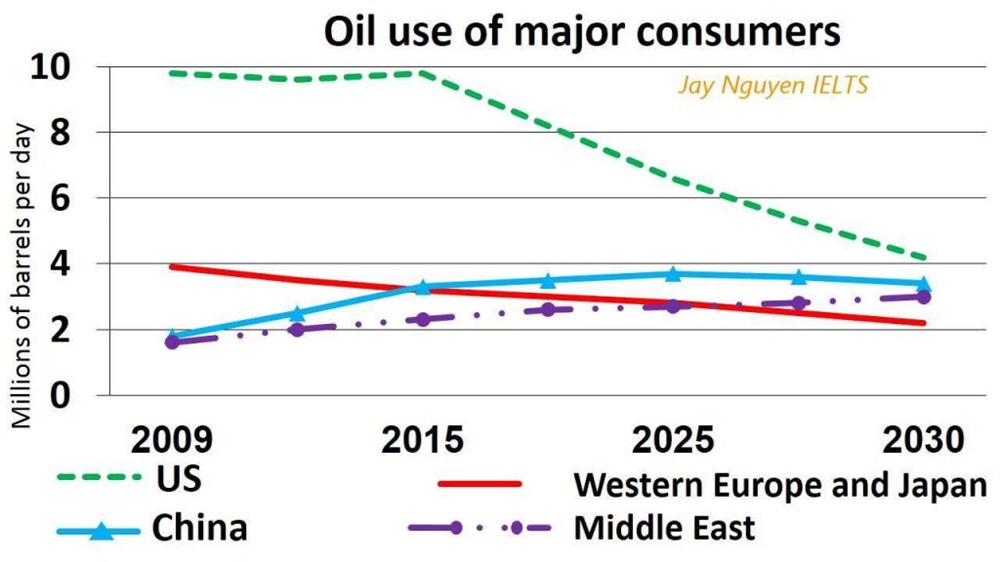
The line graph compares the amount of oil used by major buyers in four countries (US, China, Middle East, Western Europe an Japan) from 2009 to 2030. Units are measures in barrels per day.
Overall, US was by far the most oil user between 2019 and 2015 and will remain in the first place to 2030. Comparing 2019 to 2030, the amount of oil used went up in China and Middle East and dropped in the other two.
In detail, in the initial six years, the amount of oil used in US remained about the same at 10 millions and then will decrease drammatically to 4 millions in 2030. Western Europe and Japan had 4 millions oil used by major consumers in 2009, after which it will dropped by half in 2030, at around 2 millions. The starting point of Western Europe and Japan was the same as the ending point of US. China and Middle East started relatively equally, at around 2 millions, and then China used more oil than Middle East, although both countries will end up at the same level, around 2.5 millions in 2030.
Top answer
Please read my advice for Task 1 essays: IELTS TASK 1: Hints, Tips And Advice Vocabulary Words For Task 1: Reference Post
- Please read my advice for Task 1 essays: IELTS TASK 1: Hints, Tips And Advice Vocabulary Words For Task 1: Reference Post
Get the Weekly English Kit 📬
New words, one handy idiom, and a 2-minute quiz — delivered to your inbox to keep your streak alive.
Please read my advice for Task 1 essays:
Please post all the essay instructions, not just the image.
The line graph compares the amount of oil used (You cannot use the past tense for future years. Nobody has used any oil in 2029 yet.) by major buyers in four countries (US, China, Middle East, Western Europe an
 Related Questions