
PLEASE HELP ME WITH MY TASK 1 ESSAY! THANK YOU!
The vertical bar chart and line graph demonstrate the amount of rain and climate on a monthly basis in Kolkata city.
From an overall perspective, it is evident that while the precipitation was highest during the summer months, the reverse pattern was true for spring and winter. Also noteworthy is that the temperature of the investigated city oscillated over the period shown.
During the first three months of the year, the precipitation was relatively low, below 50mm before rising to exactly 50mm in April. In the following three months, there was a dramatic increase in this figure, surging by 200mm before reaching the peak of roughly 350mm in July. By sharp contrast, the amount of rainfall then experienced a significant decrease to approximately 0 mm in December.
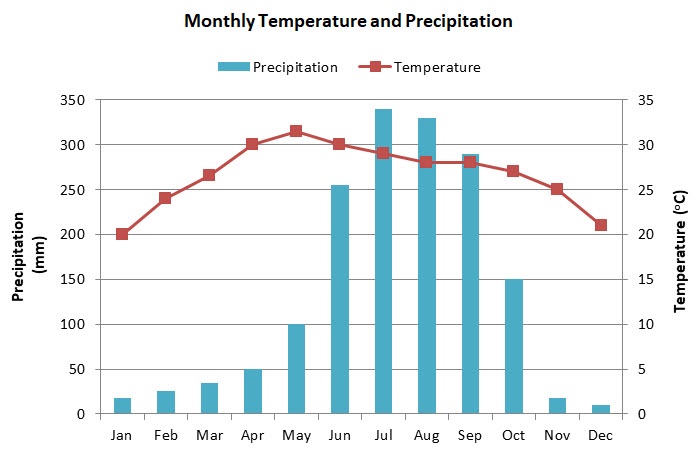
As observed, the period between January and May witnessed a progressive soar, from 20 degrees Celsius in January to approximately 30 degrees Celsius in May, respectively. In the rest of the year, there was a gradual fall to merely 20 degrees Celsius in December, which was the same as the recorded temperature in January.
Top answer
Read my advice for Task 1 essays. Refer to these links as described in my comments. If you would like a sample essay, you may request one.
- Read my advice for Task 1 essays.
- Refer to these links as described in my comments.
- If you would like a sample essay, you may request one.
- IELTS TASK 1: Hints, Tips And Advice Vocabulary Words For Task 1: Reference Post
Get the Weekly English Kit 📬
New words, one handy idiom, and a 2-minute quiz — delivered to your inbox to keep your streak alive.
Read my advice for Task 1 essays. Refer to these links as described in my comments. If you would like a sample essay, you may request one.
The vertical combined bar chart and line graph demonstrate (wrong word. Read my advice.) the amount of rain and climate ("amount of climate" makes no sense.) on a monthly basis in Kolkata city.
From an overall perspect
 Related Questions