
Please help me with my task 1 academic
Dear experts,
I have been struggling with my writing skills.
Please help correct this task 1 academic response. Thank you so much in advance.
----------------
Here's the question:
----------------
And here's my response:
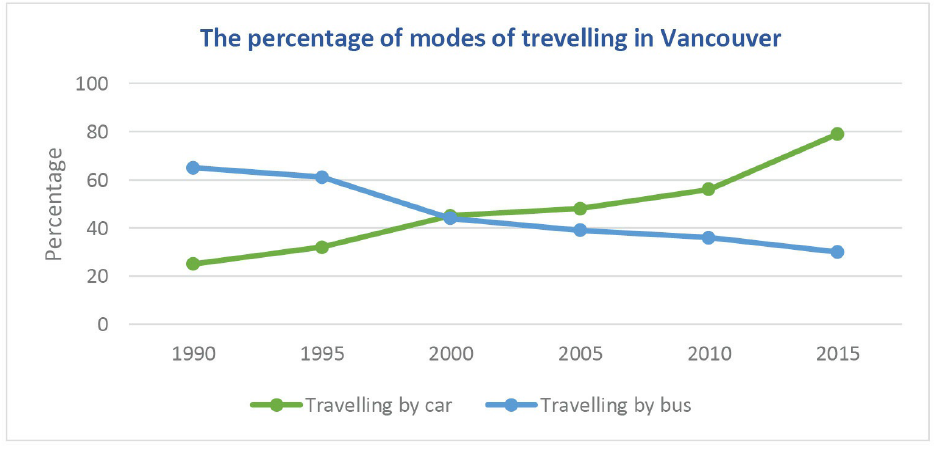
The line graph compares the figures for bus and car use in Vancouver between 1990 and 2015.
Overall, there was a downward trend in the use of bus; whereas, travelling by car witnessed a significant increase over the period.
Based on the statistics, in 1990 the percentage of car travel stood at 63% that nearly tripled that of bus travel, at 22%. Over a decade, the figures for both car and bus use met at 43% which showed a remarkable decline by 20% in the use of bus and a considerable rise by the same amount in car travel in 2010.
Over the rest of the period, the figure for car continued the upward trend to reach a peak at 80% in 2015. In contrast, the number for bus gradually fell to 25%, just nearly the same as the initial number of car travel. Thus, there were two opposite trends for car and bus use in which a significant growth by nearly 60% in car use and a noticeable fall by about 40% in bus use were seen over a quarter of the century.
Top answer
Do not use a site that puts blatant spelling errors in the tasks. Be very skeptical about these sources. They are not written by native speakers.
- Do not use a site that puts blatant spelling errors in the tasks.
- Be very skeptical about these sources.
- They are not written by native speakers.
- This one is really awful; not only is there a spelling error, but the title is very poor English, and the math is impossible too.
- Throw this one in the garbage bin.
Get the Weekly English Kit 📬
New words, one handy idiom, and a 2-minute quiz — delivered to your inbox to keep your streak alive.
Do not use a site that puts blatant spelling errors in the tasks.
Be very skeptical about these sources. They are not written by native speakers.
This one is really awful; not only is there a spelling error, but the title is very poor English, and the math is impossible too. Throw this one in the garbage bin.
 Related Questions