
Please help me with my Task 1!
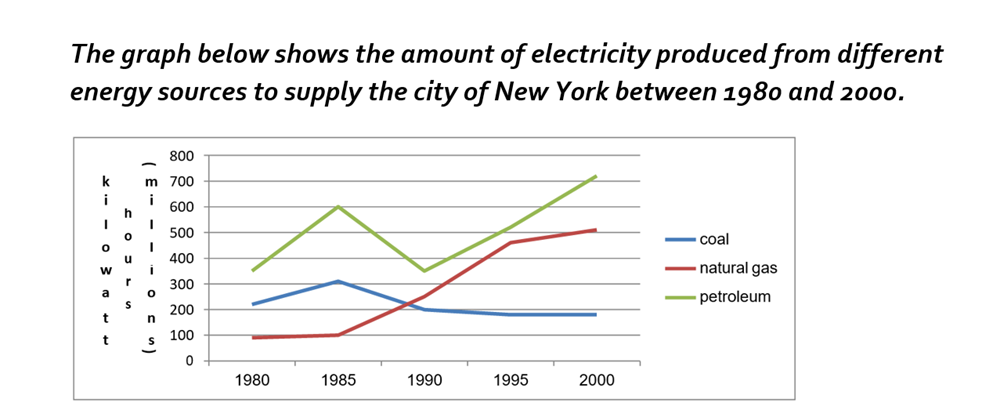
The line graph compares how much electricity was generated from 4 sources of energy to supply New York City from 1980 to 2000.
Overall, there was an increase in electricity production from petroleum and natural gas, while an opposite trend can be seen in the figure for coal. In addition, petroleum provided by far the highest amount of electricity throughout the years.
The amount of electricity produced from petroleum started at about 350 million kilowatt hours (kWh) in 1980, after which it saw a dramatic rise to 600 kWh five years later. A similar change, but to a lesser extent, can be seen in the figure for coal, which grew from approximately 210 million kWh in 1980 to reach a peak of 310 million kWh in 1985. Meanwhile, electricity supply generated from natural gas increased slightly from 90 to 100 million kWh over the first 5 years.
From 1985 to 2000, electricity generation from natural gas continued to rise significantly, reaching a peak of about 510 million kWh in 2000. By contrast, the figure for coal decreased consistently to only 180 million kWh in 1995 and levelled off towards the end of the period. Meanwhile, electricity production from petroleum dropped to 350 million kWh in 1990, followed by a two-fold rise to about 710 million kWh over the following two decades.
Get the Weekly English Kit 📬
New words, one handy idiom, and a 2-minute quiz — delivered to your inbox to keep your streak alive.
 Related Questions