
Please help me with my IELTS Writing task 1 report- Bar
Dear teacher,
Please help me with my IELTS Writing task 1 report- Bar chart.
Thank you,
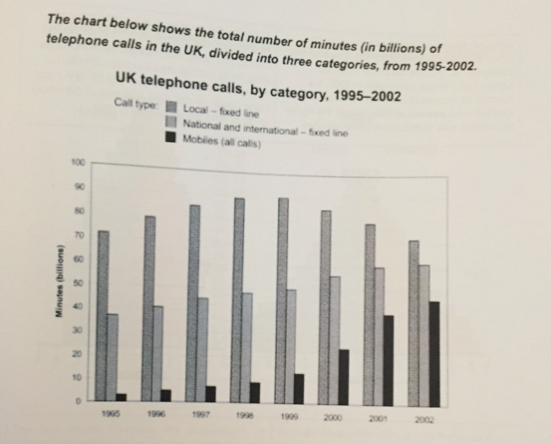
The bar chart illustrates the figure for minutes (in billions) of telephone call in British on three different kind of call between 1995 and 2002.
Overall, it is clear that the phone call with the local – fixed line type was the most popular for the people in UK. Besides, the mobile phone type was the lowest type that used by Britain. In the year 2002 witnessed a significant increase of the figure of time of the mobile phone call. It showed that people in UK tend to use more mobile phone to contact.
In the year 1995, the Britain spent over 70 billion minutes for local – fixed line calls. Besides, the nation and international calls were spent by the people in UK over 35 billion minutes. In 1995, the mobile calls were a type of call that was not popular for user in the UK and they just spent for around 4 billion minutes. Over the period 4 years, it is clear that both three kinds of calls became more popular than the year 1995. Specifically, the amount of time spent for the local – fixed line calls that used by the Britain hit the highest point at 90 billion minutes. In the year 1999, the figure for time that people in the UK used for national, international calls and mobile calls also increased steadily.
By 2002, the amount of time spent for local – fixed line dropped considerately to 70 billion minutes, while the type of calls national/international were used by the Britain rose steadily to 60 billion minutes. In the year 2002 witnessed a significant increase of the number of minutes of mobile calls type. From the year 1999 to 2002, people at the UK spent more in mobile calls and it climbed to around 45 billion minutes for mobile calls in the year 2002.
Top answer
The bar chart illustrates (wrong word) the figure (wrong word) for minutes (in billions) of telephone call (wrong form) in British (wrong word) on three different kind (wrong form) of call (wrong form) between 1995 and 2002. Model paragraph: The bar charts shows minutes spent on telephone calls for three different types of service (two types of fixed line calls - local and long distance and one type for mobile calls) for each year between 1995 and 2002. The callers were in the UK.
- The bar chart illustrates (wrong word) the figure (wrong word) for minutes (in billions) of telephone call (wrong form) in British (wrong word) on three different kind (wrong form) of call (wrong form) between 1995 and 2002.
- Model paragraph: The bar charts shows minutes spent on telephone calls for three different types of service (two types of fixed line calls - local and long distance and one type for mobile calls) for each year between 1995 and 2002.
- The callers were in the UK.
- The units of measure are billions of minutes.
- Overall, it is clear that the phone call (This means one phone call.
Get the Weekly English Kit 📬
New words, one handy idiom, and a 2-minute quiz — delivered to your inbox to keep your streak alive.
The bar chart illustrates (wrong word) the figure (wrong word) for minutes (in billions) of telephone call (wrong form) in British (wrong word) on three different
 Related Questions