
Please help me with my IELTS Writing Task 1
WRITE DESCRIPTION HERE
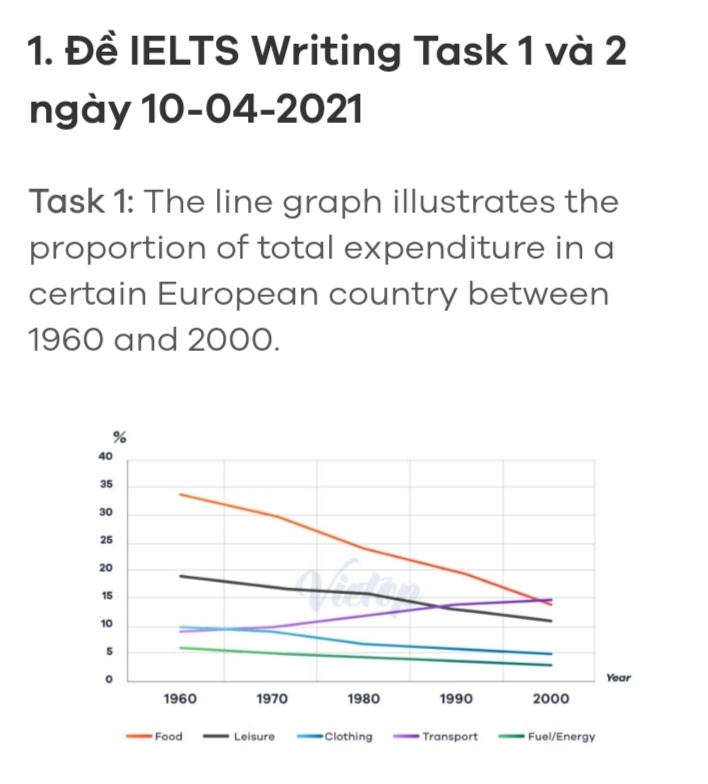
The line graph reveals how much total spending in one particular country in Europe was during 41 years from 1960 to 2000.
The intial impression from the chart is that there was a rise in the percentage of expenditure on transport while expenses food, leisure, clothing and fuel or energy showed a decreasing trend.
In 1960, while just below 10 percent was spent on food, expenditure on food occupied somewhere between 33 and 34 percent. However, in 2000, spending on food decreased exponentially to under 15 percent, whereas there was a gradual climb in expenses on transport somewhere in the vicinity of 15 percent.
While allocations for clothing and feul or energy were insignificant with lows of 10 percent and above 5 percent in 1960, expenditure on leisure account for approximately 18 percent. Then, similar patterns were evident in spending on leisure, clothing and feul or energy, with all three categories undergoing moderate decreases to roughly 11 percent, 5 percent and 3 percent respectively.
Top answer
The essay instructions are very bad English. How can a student practice an exam if the practice test is terrible?
- The essay instructions are very bad English.
- How can a student practice an exam if the practice test is terrible?
Get the Weekly English Kit 📬
New words, one handy idiom, and a 2-minute quiz — delivered to your inbox to keep your streak alive.
The essay instructions are very bad English. How can a student practice an exam if the practice test is terrible?
 Related Questions