
0
MeiNguyen Posted 7 years ago
Essay & Composition Writing
Please help me with my IELTS writing task 1 :
The pie chart illustrates four main reasons why agricultural land becomes less productive and the table gives information about how these cause affected North America, Europe and Oceania during the 1990s. Overall, the main cause of worldwide land degradation was over-grazing and during the 1990s, Europe had the highest percentage of degraded land. According to the pie chart,35% was the proportion of land which was degraded by over-grazing in the world. Deforestation was the second reason why agricultural land becomes less productive, with 25% in the percentage of degraded land affected by it. 28% and 7% was the figure for over-cultivation and the other, respectively. According to the table graph, Europe, with the highest proportion of land degraded, at 23%, suffered from deforestation (9,8%), over-cultivation (7,7%) and over- grazing (5,5%). Meanwhile, the figure for Oceania was also high at at 13%. This mainly due to over-grazing (11,3%) and deforestation and over-cultivation negative affected a bit, at 1,7% and 0%, respectively. At the same time, the proportion of degraded land in North America was quite low, at 5%. 0,2% , 3,3% and 1,5% were the figure for land degraded by deforestation, over-cultivation and over-grazing, respectively.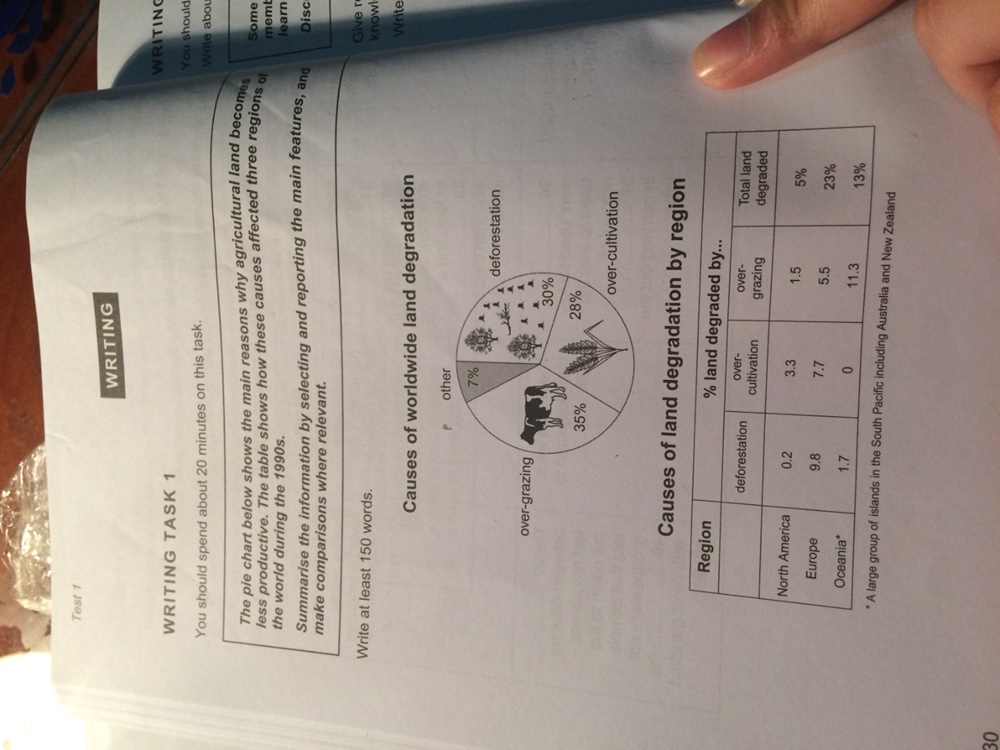
WRITE DESCRIPTION HERE
WRITE DESCRIPTION HERE
Top answer
First of all, you will get a poor score for writing one paragraph. There should be three paragraphs. Paragraph 1: Describe the figure or figures.
- First of all, you will get a poor score for writing one paragraph.
- There should be three paragraphs.
- Paragraph 1: Describe the figure or figures.
- Do not describe the data in the figures.
- What subject is being shown?
Get the Weekly English Kit 📬
New words, one handy idiom, and a 2-minute quiz — delivered to your inbox to keep your streak alive.
1 Answers
0
First of all, you will get a poor score for writing one paragraph. There should be three paragraphs.
Paragraph 1: Describe the figure or figures. Do not describe the data in the figures. What subject is being shown? What is the format (graph, chart, table, map, or diagram)? What is the time scale, period, or dates? What are the units of measurement? How many categories are there? What a
 Related Questions