
Please help me with my ielts task 1
TOPIC:
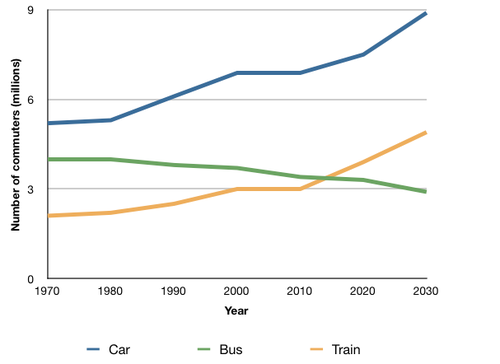
The graph below shows the average number of UK commuters traveling each day by car, bus or train between 1970 and 2030.
Write a report for a university, lecturer describing the information shown below.
Summarise the information by selecting and reporting the main features and make comparisons where relevant.
My essay:
The line graph plots the number of British who commute to work per day by each of three means of transport from 1970 to the present day, with a forecast to 2030. The means consist of two public transportation, buses and trains, and one personal commuting vehicle, cars.
Overall, the numbers of commuting by cars was about or over that of the public transportation, ( buses and trains) over the period, and that same trend is forecast to continue into the future. in addition, it is highly positively correlated with travelling by trains; both are trending upwards, except for two plateaus during 1970-1980 and 2000-2010. In contrast, car usage started as second place, but a continuous drop to end at third place is expected.
In detail, the total number of daily commuters was 11 million in 1970, with cars having the largest proportion at 45% ( 5 million), followed by buses (4 million) and trains, 2 million. These three remained around that level until 1980, when commuting by buses decreased in a linear fashion, eventually equalling that of trains in 2015 at 3.5 million each. In contrast, there was a percentage increase of about 40% and 50% by 2000 in the car and train ridership, respectively. Their numbers stayed the same for the next ten years. The predictions show that by 2030, there will be approximately 6 million more travelers than in 1970, most of that attributed to cars, a rise of 4 million. About 5 million commuters are expected to ride trains, and 3 million by buses.
Thank you so much!
Top answer
The line graph plots the number of British who commute to work per day by each of three means of transport (Busses, trains and cars) from 1970 to the present day, with a forecast to 2030. The means consist of two public transportation, buses and trains, and one personal commuting vehicle, cars. ) Overall, the numbers of commuting by car s was is higher than by mass transport for both actual and projected data.
- The line graph plots the number of British who commute to work per day by each of three means of transport (Busses, trains and cars) from 1970 to the present day, with a forecast to 2030.
- The means consist of two public transportation, buses and trains, and one personal commuting vehicle, cars.
- ) Overall, the numbers of commuting by car s was is higher than by mass transport for both actual and projected data.
- about or over that of the public transportation, ( buses and trains) over the period, and that same trend is forecast to continue into the future .
- in addition, it is highly positively correlated with travelling by trains ; both are trending upwards, except for two plateaus during 1970-1980 and 2000-2010 .
Get the Weekly English Kit 📬
New words, one handy idiom, and a 2-minute quiz — delivered to your inbox to keep your streak alive.
The line graph plots the number of British who commute to work per day by each of three means of transport (Busses, trains and cars) from 1970 to the present day, with a forecast to 2030. The means consist of two public transportation, buses and trains, and one personal commuting vehicle, cars.
(Your essay is way too long,
 Related Questions