
Please Help Me With My Essay - IELTS Task 1 (4)
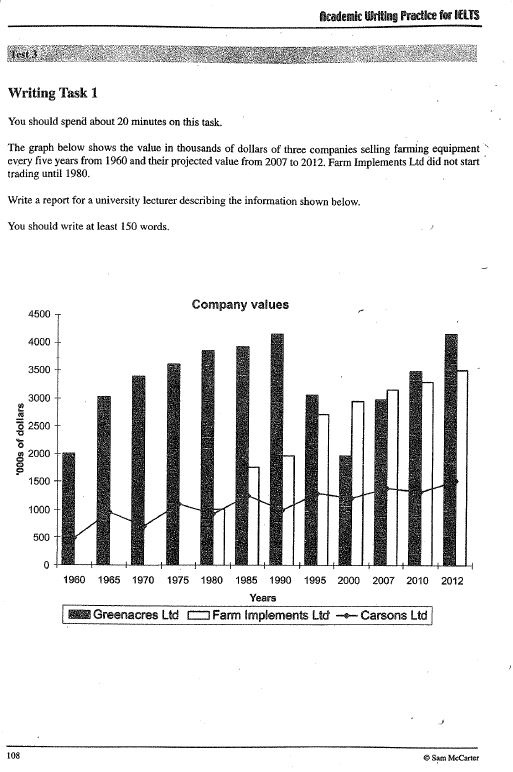
The graph compares the value of three companies which sold farming equipment every five years since 1960 and its projection from 2007 to 2012. They were Greenacres Ltd, Farm Implements Ltd and Carsons Ltd and the values were in thousands of dollars.
Overall, there was an upward trend in the values of Farm Implements Ltd and Carsons Ltd. Greenacres Ltd, after a fall, was expected to considerably rise again.
At the beginning of the period, the value of Greenacres Ltd started from $2000 thousand, which was four times the number of Carsons Ltd ($500 thousand). From 1960 to 1990, the value of Greenacres Ltd had grown considerably with the highest peak of $4000 thousand in 1990. Meanwhile, Carsons Ltd’s value increased once every five years. The number it had in 1985 doubled the one in 1960 (over $1000 thousand). It was not until 1980 that Carsons Ltd started to join the trade. From $1000 thousand in 1980, the figure of this new company rose to nearly 2000 thousand in 1990.
Between 1990 and 2000, the growing trend still occurred to the value of Farm Implements Ltd. It gradually grew to approximately $2700 thousand in 2000. In contrast, Greenacres Ltd had a decreasing value which was about 3200 thousand in 1995 and 2000 thousand in 2000. Carsons Ltd’s figures had some slight changes and the number was 1250 thousand in 2000.
All three companies were projected to have their values increased continually from 2007 to 2012. It was expected that Greenacres Ltd’s value would be $4000 thousand in 2012. In the same year, Farm Implements Ltd would worth $3500 thousand and Carsons Ltd was likely to have the lowest figure of $1250 thousand.
Top answer
The graph compares the value of three companies which sold farming equipment every five years since 1960 and its projection from 2007 to 2012. They were Greenacres Ltd, Farm Implements Ltd and Carsons Ltd and the values were in thousands of dollars. ) Model paragraph: The bar graph gives the values in thousands of dollars of three farm equipment companies during the period from 1960 to 2000, with a data point shown every five years.
- The graph compares the value of three companies which sold farming equipment every five years since 1960 and its projection from 2007 to 2012.
- They were Greenacres Ltd, Farm Implements Ltd and Carsons Ltd and the values were in thousands of dollars.
- ) Model paragraph: The bar graph gives the values in thousands of dollars of three farm equipment companies during the period from 1960 to 2000, with a data point shown every five years.
- It then gives their projected values in three years: 2007, 2010 and 2012.
- The companies were Greenacres Ltd, Farm Implements Ltd and Carsons Ltd.
Get the Weekly English Kit 📬
New words, one handy idiom, and a 2-minute quiz — delivered to your inbox to keep your streak alive.
The graph compares the value of three companies which sold farming equipment every five years since 1960 and its projection from 2007 to 2012. They were Greenacres Ltd, Farm Implements Ltd and Carsons Ltd and the values were in thousands of dollars.
("sold farm equipment every five years" means that the company only sold equipment in one
 Related Questions