
Please Help Me With My Essay - IELTS Task 1
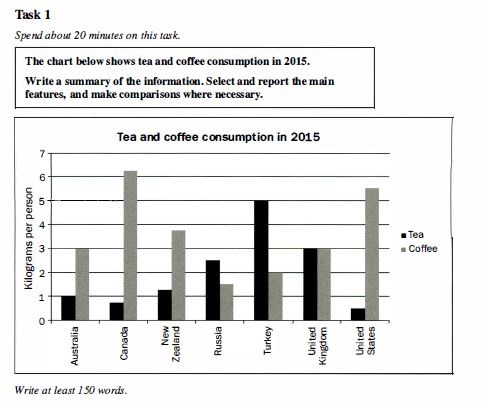
The chart gives the amount of tea and coffee consumed by people of seven countries in 2015. The data is in the form of kilograms per person. The countries included Australia, Canada, New Zealand, Russia, Turkey, the United Kingdom and the United States.
Overall, there were more people who drank tea than that of coffee in Russia and Turkey. Contrastingly, coffee was consumed more than tea in Australia, Canada, New Zealand and the US. It is clear that the amount of tea and coffee consumption were equal in the UK.
As can be seen, people in Russia and Turkey consumed more tea than coffee. Over the year, a Turkish drank 5kg of tea which was 2.5 times more than that of coffee (2kg). Similarly, about 2.5kg of tea and 1.5kg of coffee were consumed by a Russian.
In contrast, coffee was the more popular beverage in Australia, Canada, New Zealand and the US. At the very least, the amount of coffee consumption was tripled the tea consumption in these nations. Noticeably, a Canadian used about 0.8kg of tea, while he/she drank up to 6.1kg of coffee. We can also see that a British person consumed the same amount of coffee and tea in a year (3kg of each drink).
-----------------------------------------
Thanks so much for helping me!
Top answer
) chart gives the amount of tea and coffee consumed by people of seven countries in 2015. The units of measure are data is in the form of kilograms per person. The countries included Australia, Canada, New Zealand, Russia, Turkey, the United Kingdom and the United States.
- ) chart gives the amount of tea and coffee consumed by people of seven countries in 2015.
- The units of measure are data is in the form of kilograms per person.
- The countries included Australia, Canada, New Zealand, Russia, Turkey, the United Kingdom and the United States.
- ) who drank tea than that of coffee in Russia and Turkey.
- ) Contrastingly , In contrast, coffee was consumed more than tea in Australia, Canada, New Zealand and the US.
Get the Weekly English Kit 📬
New words, one handy idiom, and a 2-minute quiz — delivered to your inbox to keep your streak alive.
The (what type of chart?) chart gives the amount of tea and coffee consumed by people of seven countries in 2015. The units of measure are data is in the form of kilograms per person. The countries included Australia, Canada, New Zealand, Russia, Turke
The diagram illustrates kilograms of tea and coffee per person consumed in 7 countries Australia,Canada,New Zealand,Russia,Turkey, United Kingdom and the United States in 2015.
Overall,many countries got more tea consumption than coffee and the United States had a smallest proportion for tea,accounting for under 1 kilogram.
As surveyed,Canada took a lead in coffee consumption per p
 Related Questions