
Please Help Me With My Essay - IELTS Task 1 (1)
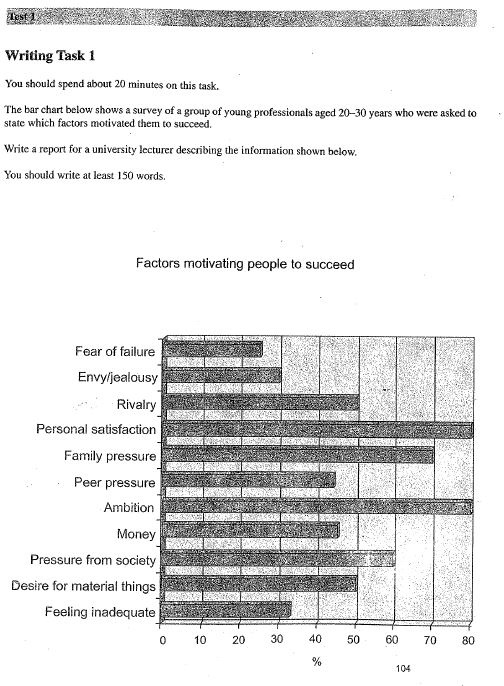
The bar chart illustrates the results of a survey on young people aged 20-30 about factors which generate their motivation for success in the workplace.
These factors can be divided into three groups. In the first leading group, personal satisfaction and ambition are factors which are mentioned the most by people (about 80% of the survey participants). They are followed by external pressure from family and society, with the percentage of 70% and 60%, respectively. The second group involves rivalry and desire for material things which are equally mentioned by half of those questioned. Money comes next in the same category specified by approximately 45% of people and is closely followed by peer pressure, with 2% less of its rate. The remaining group is factors which encourage young workers the least. About 32% of people talk about the sense of feeling inadequate and jealousy which has the percentage of 30% is close behind. The fear of failure lies last as it is mentioned by only 25% of people.
In overall, internal factors are better incentives for young professionals to succeed in their career. They also depend more on their personal feelings than money or materials to gain motivation for achievements at work.
(202 words)
Top answer
The bar chart illustrates (Use "illustrate" for a picture or diagram like a process map. It is not good for a bar chart, pie chart of line graph. ) plots / gives / depicts the results of a survey on young people aged 20-30 about factors which generate their motivation for success in the workplace.
- The bar chart illustrates (Use "illustrate" for a picture or diagram like a process map.
- It is not good for a bar chart, pie chart of line graph.
- ) plots / gives / depicts the results of a survey on young people aged 20-30 about factors which generate their motivation for success in the workplace.
- (Your first paragraph is incomplete.
- ) Model paragraph: The bar chart gives the percentages from a group of young professionals who ascribed certain motivation factors that inspire them to achieve success.
Get the Weekly English Kit 📬
New words, one handy idiom, and a 2-minute quiz — delivered to your inbox to keep your streak alive.
The bar chart illustrates (Use "illustrate" for a picture or diagram like a process map. It is not good for a bar chart, pie chart of line graph. ) plots / gives / depicts the results of a survey on young people aged 20-30 about factors which generate their motivation for success in the workplace. (Your first paragraph is incomplete. It does not tell the reader the
 Related Questions