
Please help me with IELTS Writing Task 1
WRITE DESCRIPTION HERE
Hello everyone,
Please help me to correct this IELTS Writing Task 1 below:
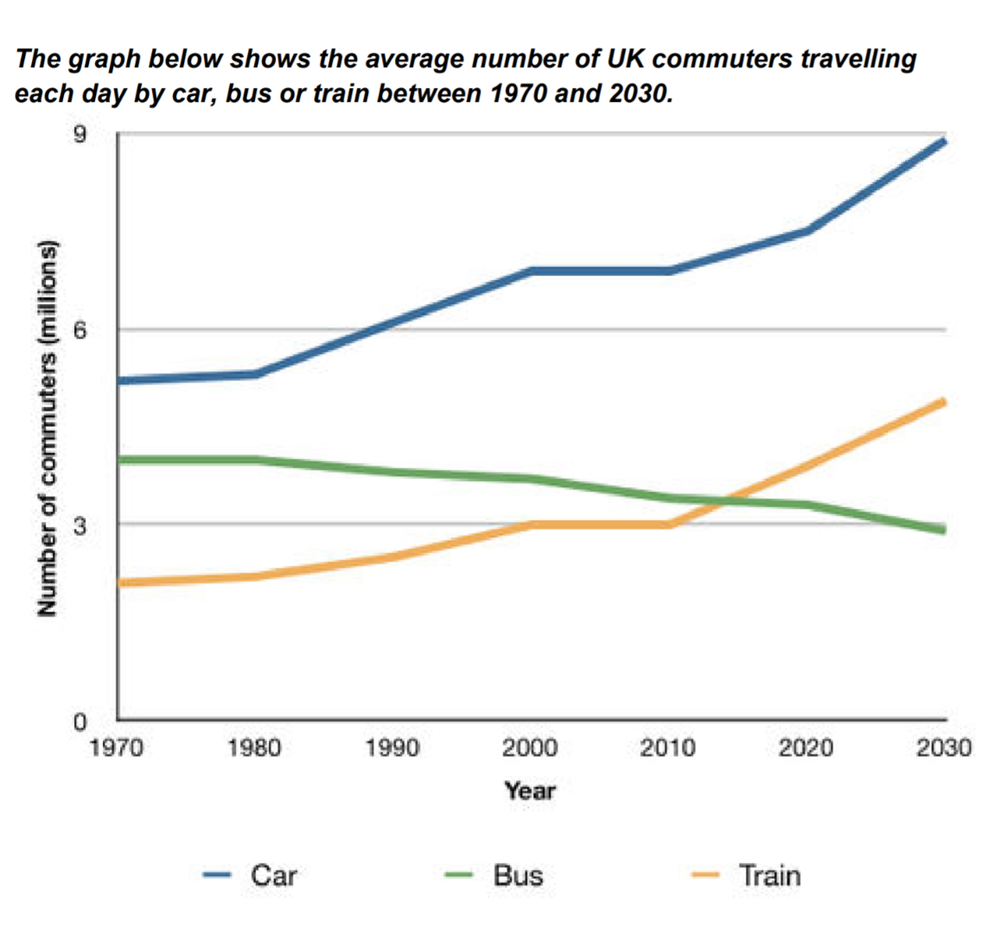
The line graph compares the average number of daily UK commuters traveling by means of car, bus or train between 1970 to 2030.
It is clear that there are significant changes in the amount of UK commuters traveling each day by all 3 car, bus or train in 60 years shown on the graph. While the trends of people traveling by train and car go up gradually, it is a steady reduction of bus between 1970 to 2030.
By 1970, the numbers of commuters traveling by train and bus was around 2 and 4 million while around 5 million people traveled by car. Over the following forty years, the steady upward trends of car and train were seen while it witnessed the moderate reduction of bus.
From 2010 to 2030, it is anticipated that the trends of both car and train will increase by 2 millions while the amount of bus will decline by 0,5 million. In 2030, prediction shows that the commuters of train will rise to nearly 5 millions and the figure of commuters of car will reach a peak of 9. By contrast, the constant downward trend of bus is expected to 3.
Thanks for helping me! 
Top answer
Please post essays, paragraphs, dialogues and other writing in the essay forum so a moderator does not have to move your post.
- Please post essays, paragraphs, dialogues and other writing in the essay forum so a moderator does not have to move your post.
Get the Weekly English Kit 📬
New words, one handy idiom, and a 2-minute quiz — delivered to your inbox to keep your streak alive.
Please post essays, paragraphs, dialogues and other writing in the essay forum so a moderator does not have to move your post.
Please read my advice for Task 1 essays. Also, when you mention data values, be sure to write the correct numbers.
 Related Questions