
Please Help Me With IELTS Writing Task 1.
The graph below shows the amounts of waste produced by 3 companies over a period of 15 years.
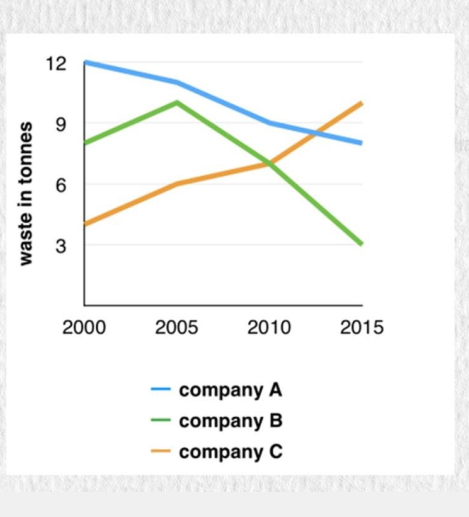
The illustrated line graph depicted the total number of garbage in tones thrown out by three corporations over the course of 15 years.
Overall, company A and B’s amounts of trash were to be cut down while that of company C demonstrated an upward trend.
As for company A and B, both of which the amounts of trash stood at approximately 9 and 12 tones in 2000, much more than that of company C. Company A’s number of garbage were reduced steadily over 15 years (at about 9 tones in 2015). On the contrary, the number of garbage of company B increased during the first 5 years and afterwards, similar to company A, it decreased in a swift fashion, with the production of only 3 tones in 2015.
Company C’s number of waste, however, started at just above 3 tones in 2000, then showed a gradual rise to about 7 tones in 2010 and plummeted to 11 tones at the end of the period
Top answer
The illustrated line graph depicted (Wrong tense. ) the total number of garbage (Garbage is non-count. You cannot count garbage in numbers.
- The illustrated line graph depicted (Wrong tense.
- ) the total number of garbage (Garbage is non-count.
- You cannot count garbage in numbers.
- ) thrown out produced by three corporations over the course of 15 years.
- (Which 15 years?
Get the Weekly English Kit 📬
New words, one handy idiom, and a 2-minute quiz — delivered to your inbox to keep your streak alive.
The illustrated line graph depicted (Wrong tense. The line graph exists in the present time.) the total number of garbage (Garbage is non-count. You cannot count garbage in numbers. Number of garbage is ungrammatical English.) in tones
 Related Questions