
Please help me with Ielts writing task 1
How the percentage of people living in poor conditions was allotted for various kinds of families in the United Kingdom during the year 2002 can be summarized as follows.
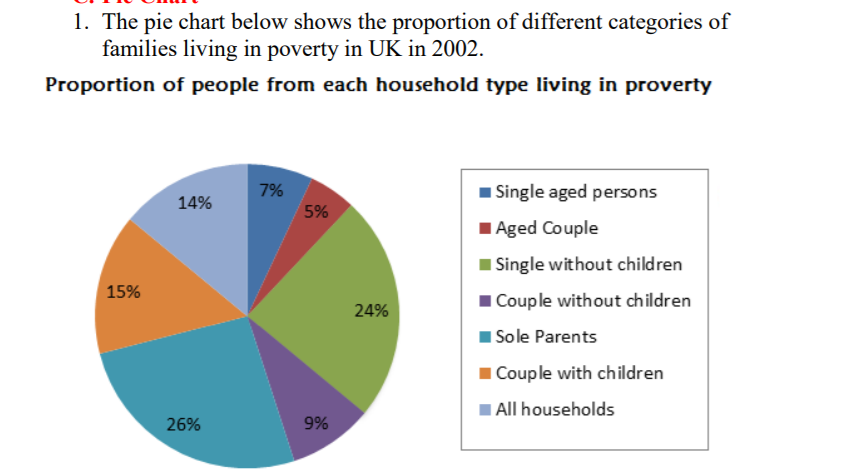
From an overall perspective, almost the poor came from households which had only one person in their families, such as singles or sole parents, while the most minority of impoverished families was made up by aged couple.
It is clear from the pie chart, people from sole parents took up the highest proportion of households living in poverty (exactly 26%) followed by single without children constituting just under a quarter. Meanwhile, the single elderly and couple without children nearly shared the mere figures with 9% and 7% of households being in poverty respectively. Also, the lowest percentage of poor families belonged to elderly couples, accounting for just 5%. Besides, the rest of the percentage was distributed into two similar shares with slightly higher one for couple with children (15%) and the other for all households (14%).
Top answer
Where did you find that question? I don't understand what it means by "All households".
- Where did you find that question?
- I don't understand what it means by "All households".
Get the Weekly English Kit 📬
New words, one handy idiom, and a 2-minute quiz — delivered to your inbox to keep your streak alive.
Where did you find that question? I don't understand what it means by "All households".
 Related Questions