
Please help me with ielts writing task 1
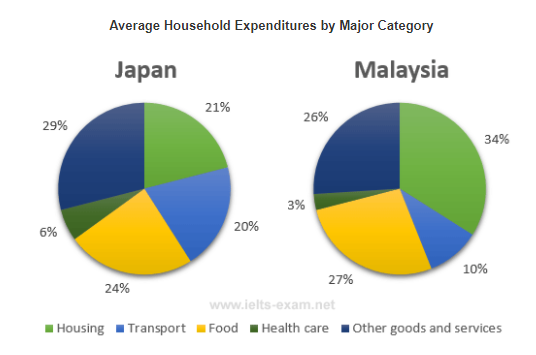
The two pie charts reveal the spending percentages of five categories in Japan and in Malaysia in the year 2010.
Overall, people spent the most money on housing, food, other goods and services. However, the average proportions of household expenditure on transport and on other goods and services in Japan were larger than in Malaysia.
Out of the two countries, the highest percentage shown on the two charts belonged to Malaysia, with 34% spending on housing, while in Japan housing was responsible for just 21% of the total. On the other hand, in Malaysia other goods and services was ahead in terms of expense with 29%, compared to 26% of Malaysia. Food was at the second place in Japan, holding 24%; whereas in Malaysia the actual proportion was slightly larger (27%). Both the expenditure percentages of transport and health care in Japan were twice as high as those in Malaysia, but the smallest part was on health care in both nations.
Thank you so much.
Get the Weekly English Kit 📬
New words, one handy idiom, and a 2-minute quiz — delivered to your inbox to keep your streak alive.
 Related Questions