
Please help me with IELTS task 1
The chart below gives the information from a 2008 report about consumption of energy in the USA since 1980 with projections until 2030. Summarize the information by selecting and reporting the main features, and make comparisons where relevant.
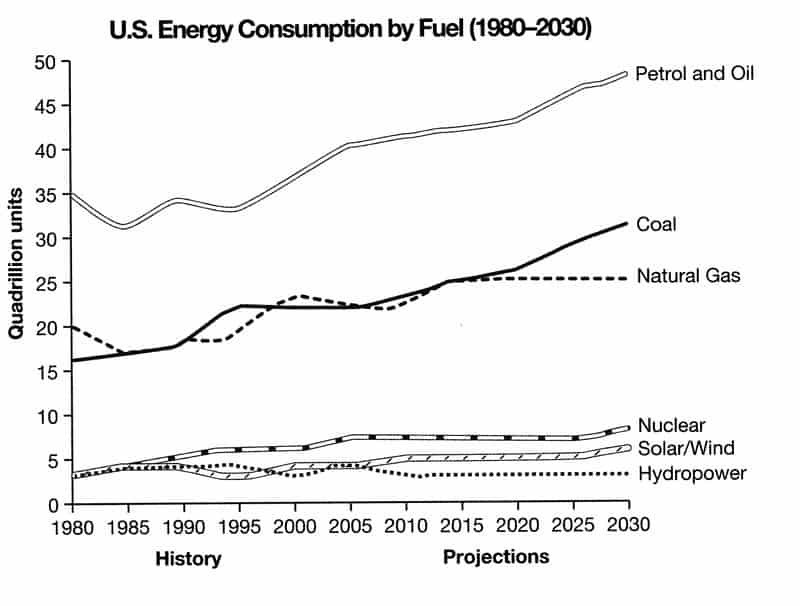
The given line chart illustrates the number of units of different types of energy consumed in America from 1980 to 2030.
Overall, it can be clearly seen that the usage of oil and petrol remains highest over the period. In addition, the figures for nuclear, solar/wind and hydropower stay unchanged in the given period of time.
In 1980, the total units of petrol and oil used in the USA are 35 quadrillion in comparison with about 17 quadrillion and 20 quadrillion units for cola and natural gas respectively. In 2005, the figure for petrol and oil increased sharply to over 40 quadrillion units and are estimated to rise to nearly 50 quadrillion by 2030. Meanwhile, despite some fluctuations, the figures for coal and natural gas will significantly go up to nearly 30 quadrillion and 25 quadrillion units as predicted in the given order.
Starting at only 3 quadrillion units in 1980, it is predicted that the consumption of nuclear and solar/wind will rise to 8 and 6 quadrillion units in 2030. On the other hand, the figure for hydropower remains stable over the period.
Top answer
The given (Do not use "given", "provided" or other such words. ) line chart (There are bar charts, pie charts, eye charts, flow charts and organization charts. There is no such thing as a line chart) illustrates (wrong word.
- The given (Do not use "given", "provided" or other such words.
- ) line chart (There are bar charts, pie charts, eye charts, flow charts and organization charts.
- There is no such thing as a line chart) illustrates (wrong word.
- ) the number of units of different types of energy (poor English, also what types are shown, How many?
- ) in America from 1980 to 2030.
Get the Weekly English Kit 📬
New words, one handy idiom, and a 2-minute quiz — delivered to your inbox to keep your streak alive.
The given (Do not use "given", "provided" or other such words. They are very unnatural here.) line chart (There are bar charts, pie charts, eye charts, flow charts and organization charts. There is no such thing as a line chart) illustrates (wrong word. Read my advice for
The first thing to do on the graphs that cover past and future is to determine what years are "past" and what years are "future."
You need to use past tense verbs for the past years and present or future tense for the "future" years.
In this task, any data points after 2008 are "future" and all the others are past. Why is that? Because the research project that made t
 Related Questions