
Please help me with a double data source response!
You please help me with this type of academic task 1 questions.
I have already encountered this type twice in the real IELTS writing exam.
And it made me completely puzzled so I was unable to compose a good task 1 essay.
-----------
Here's the quesetion:
---------
And here's my response:
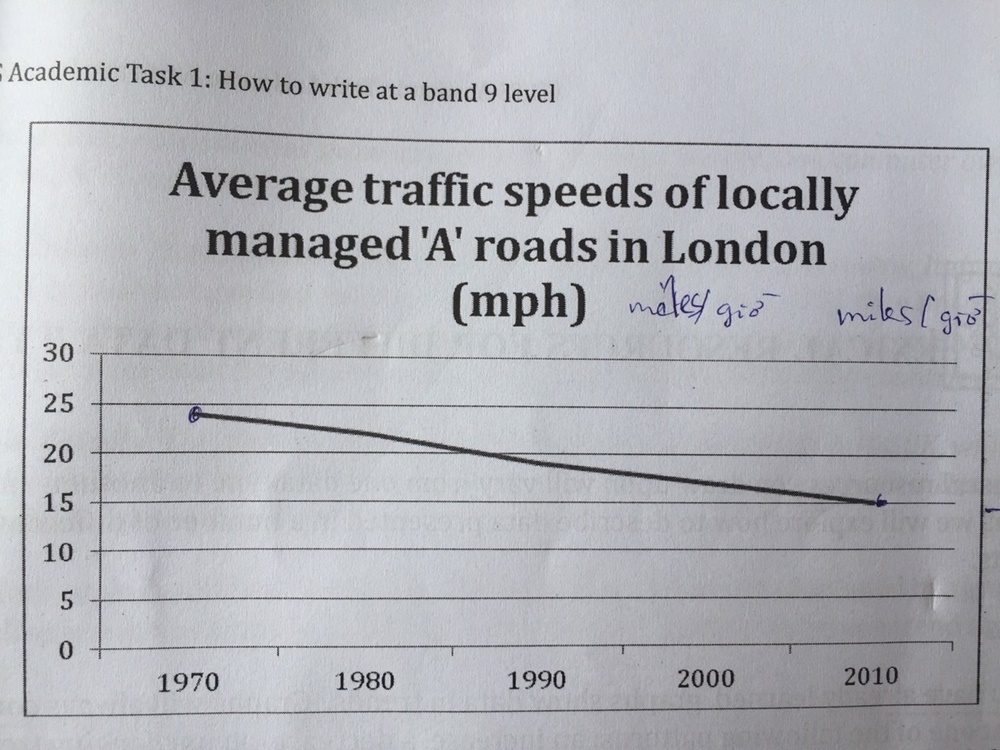
The first line graph illustrates the ways London people went to work (by car, bus, subway, bicycle and on foot) and the second presents London average traffic speeds over four decades from 1970 to 2010. It can easily be seen from the two charts that Londoners tended to find other means of tranportation to travel to work due to increasing traffic congestion during the period.
Over the first half of the period, 40% of people in London travelling to work in 1970 swelled to 48% in 1990; conversely, those for underground and bus fell from 33% and 22% to 27% and 17% respectively; Over the remaining time period, there were converse trends, in which London’s car users fell to only 34%; whereas, those of subway rised to 36%, and bus figure remained relatively unchanged until 2010. The percentage of people going on foot or by bike climbed gradually from 2% each in 1970 to only 4% and 8% respectively in 2010.
Looking at the second graph, it is clear that there was a gradual decline in London traffic speeds from 24 miles per hour in 1970 to just 15 miles per hour in 2010. This much slower speed explicity indecated more serious traffic jams in London year by year; therefore, more Londoners opted to move about by public transport than those travelling by private vehicles to avoid traffic congestion
Top answer
You please help me with this type of academic task 1 questions. I have already encountered this type twice in the real IELTS writing exam. And it made me completely puzzled so I was unable to compose a good task 1 essay.
- You please help me with this type of academic task 1 questions.
- I have already encountered this type twice in the real IELTS writing exam.
- And it made me completely puzzled so I was unable to compose a good task 1 essay.
- Thank you so much in advance.
- ----------- Here's the quesetion: --------- And here's my response: The first line graph illustrates the ways London people went to work (by car, bus, subway, bicycle and on foot) and the second presents London average traffic speeds over four decades from 1970 to 2010.
Get the Weekly English Kit 📬
New words, one handy idiom, and a 2-minute quiz — delivered to your inbox to keep your streak alive.
You please help me with this type of academic task 1 questions.
I have already encountered this type twice in the real IELTS writing exam.
And it made me completely puzzled so I was unable to compose a good task 1 essay.
Thank you so much in advance.
-----------
Here's the quesetion:
 Related Questions