
Please help me to review this Task 1 essay!
The chart shows the hours per week spent watching TV by gender and by age group in 2001 in Australia.
Summarise the information by selecting and reporting the main features, and make comparison where relevant.
Write at least 150 words.
The bar chart gives information about the time spent watching TV by Australian citizens per week by gender in various age groups in 2001.
Overall, the number of hours spent on TV by females was higher than that of by males in every age group, except the age group from 36 to 45 where men were spending more time on TV than women. Moreover, there was a huge gap in the amount of time per week between males and females under 15.
To be specific, females under 15 spent far more time watching TV than males (26 hours as opposed to 15 hours), which was also the highest one in the number of hours weekly spent on TV. As for other age groups (15-25, 26-35, 46-55 and over 55 years old) the amount of time spent watching TV by females always were higher than males, although the differences were not significant). Another striking feature was that in the ages from 36 to 45 both genders accounted for the lowest net hours spent on TV, which was 8 and 10 hours respectively.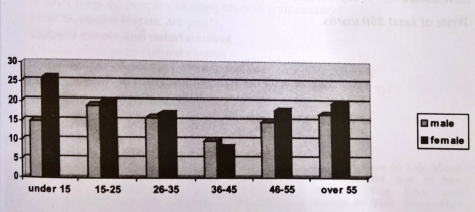
Get the Weekly English Kit 📬
New words, one handy idiom, and a 2-minute quiz — delivered to your inbox to keep your streak alive.
 Related Questions