
Please help me to review this Task 1 essay!
The chart shows the unemployment situation in Australia in the year 2012.
Summarise the information by selecting and reporting the main features, and make comparisons where relevant.
You should write at least 150 words.
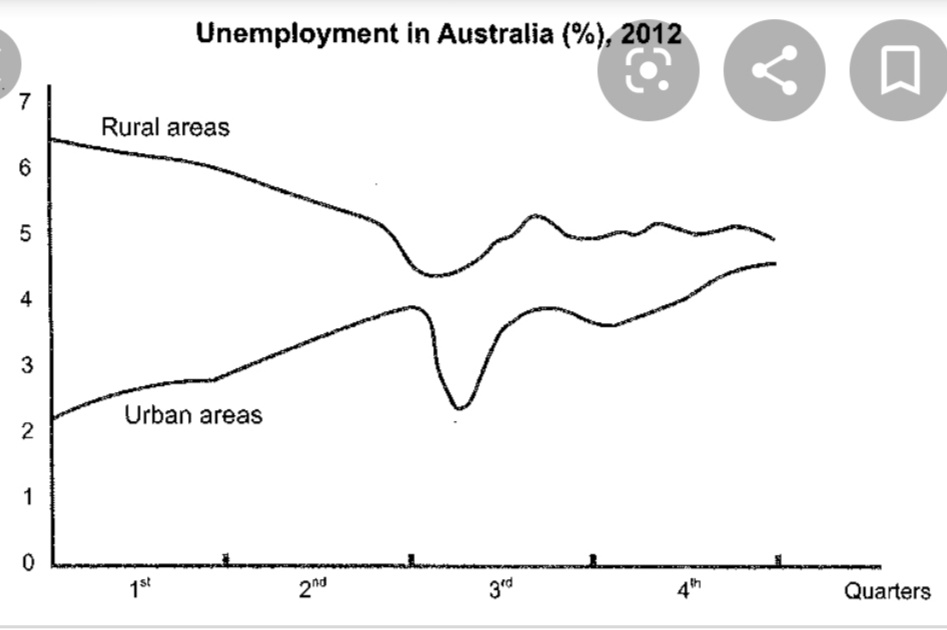
The line graph compares the alarming unemployment rate of Australia for two specific areas, rural and urban areas, in 2012. It divided into four periods of time in a year which is regarded as quarters.
Overall, this period showed a fluctuation linear in both two separate residences and the percentage of unemployment rate in rural areas was higher than in urban areas during the period. It also insisted that there was a huge gap at the begin and ended with nearly similar percentage.
In specific, from the first to the second quarter of the year, the proportion of unemployment situation in rural areas was slightly declined while in urban areas was increased from 2% to approximately 4%. Moreover, the percentage of unemployed people in the first and the third period was similar, which was respectively 2%. In contrast, in rural areas there was slightly changes around 5% in the third and fourth quarters of the year. At the end of the year, which was the fourth quarter, both these two areas were accounted for alike percentage, which was nearly 5%.
Get the Weekly English Kit 📬
New words, one handy idiom, and a 2-minute quiz — delivered to your inbox to keep your streak alive.
 Related Questions