
PLEASE HELP ME TO FIX AND GIVE THE SCORE FOR MY WRITING TASK 1. THANK YOU!!!
The given bar chart illustrates the proportion of the homeowners and renters in the age from 25 to 34 in the UK. Overall, this group of British tended to have their own houses before 2009 while in the 2010s, they prefered to rent for accommodation.
To begin with, from 2004 to 2009, the percentage of British who were homeowners was almost more than 50%. In the same time, the proportion of renters increased moderately from nearly 20% to approximately 36%.
After that, from 2009, the percentage of people owning houses in the UK had a substantial decrease and levelled off at nearly more than 42% in 2011 and 2012. Contrastly, in those years, there was a dramatic soar in the proportion of renting houses by 10% approximately.
After a significant fall, the percentage of homeowners continuously went off consistently to 36% in 2014. Whereas, we can easily observe that the percentage of renters rose steadily by about 6% and peaked at approximately 47% in 2014.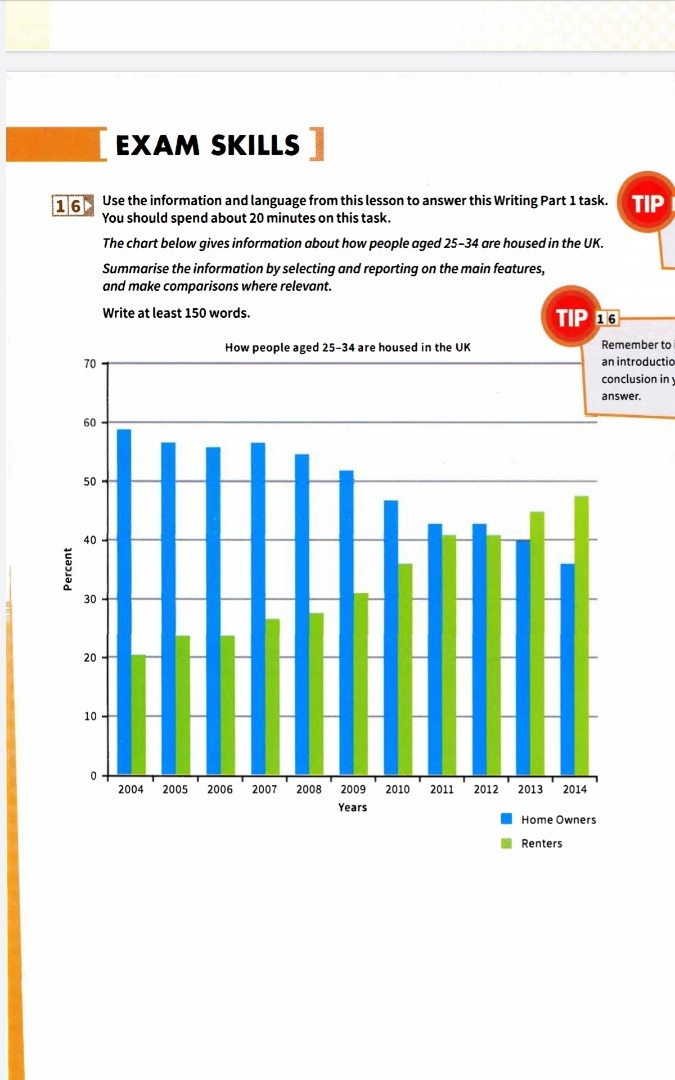
Top answer
The given (Do not use "given" or "provided". ) bar chart plots / gives / compares illustrates (Not a good word choice) the proportion of the homeowners and renters in the age group from 25 to 34 in the UK. (What is the time period?
- The given (Do not use "given" or "provided".
- ) bar chart plots / gives / compares illustrates (Not a good word choice) the proportion of the homeowners and renters in the age group from 25 to 34 in the UK.
- (What is the time period?
- How frequently are the data points?
- ) (You have changed topics.
Get the Weekly English Kit 📬
New words, one handy idiom, and a 2-minute quiz — delivered to your inbox to keep your streak alive.
The given (Do not use "given" or "provided". It is not native English.) bar chart plots / gives / compares illustrates (Not a good word choice) the proportion of the homeowners and renters in the age group from 25 to 34 in the UK. (What is the time period? Ho
Please post essays, paragraphs, dialogues and other writing in the essay forum so a moderator does not have to move your post.
https://www.englishforums.com/English/EssayReportCompositionWriting/Forum9.htm
---------------------
Please
 Related Questions