
Please help me to correct my Writing task 1
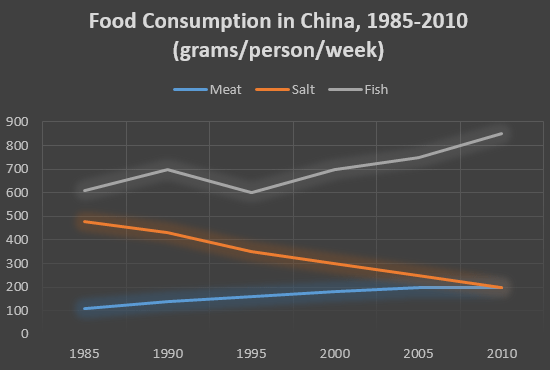
The line graph compares the volume of three types of food consumed in China over a period of 25 years.
It is clear from the graph that Fish is by far the most popular food in Chinese meals. By contrast, Meat is least consumed over the period shown.
In 1985, 600 grams of Fish was weekly used by an individual – nearly six fold more than that in Meat while this figure for Salt was just under 500 grams. Over following 10 years, the Fish consumption stood at the same level after reached a high of 700 grams in 1990.
From 1985 to 2010, the weekly usage of Salt by each Chinese decreased significantly to a low at nearly 200 grams – similar to that in Meat after a slight increase from 100 grams in 1985. Meanwhile, the Fish consumption rose dramatically to peak at around 850 grams/person/week in 2010.
Top answer
The line graph compares the volume (amount / weight in grams) of three types of food consumed in China over a period of 25 years. It is clear from the graph It shows that f ish is by far the most popular food in Chinese meals. By contrast, m eat is least consumed over the period shown.
- The line graph compares the volume (amount / weight in grams) of three types of food consumed in China over a period of 25 years.
- It is clear from the graph It shows that f ish is by far the most popular food in Chinese meals.
- By contrast, m eat is least consumed over the period shown.
- In 1985, 600 grams of f ish was weekly used by an individual – nearly six fold more than that in M eat while this figure for S alt was just under 500 grams.
- Over (missing word) following 10 years, the F ish consumption stood at the same level (??
Get the Weekly English Kit 📬
New words, one handy idiom, and a 2-minute quiz — delivered to your inbox to keep your streak alive.
The line graph compares the volume (amount / weight in grams) of three types of food consumed in China over a period of 25 years.
It is clear from the graph It shows that fish is by far the most popular food in Chinese meals. By contrast, meat is least consumed over the period shown.
In 1985, 600 grams of fish was weekly
 Related Questions