
0
Henry Lu Posted 9 years ago
Essay & Composition Writing
Please help me to correct my Ielts Writing Task 1 below
The line graph illustrates the food expenditure in a European country over the course of 25 years. Looking at the graph, it is immediately clear that there was a dramatic increase on chicken consumption whereas the corresponding expenditure on beef, lamb, and fish had fallen considerablely over the period survey. According to data from the graph, the amount of beef consumed was the highest , more than 220 grams a week per capita in 1979 . Chicken and lamb consumption were lower, at under 150 grams and exactly 150 grams , respectively. On the other hand, fish was the European ' s lowest attracrion, just around 60 grams per single resident per week. In the period 1979 to 2004, we can oviously see that the beef expenditure was dropped rapidly after reaching a peak of about 240 grams, it went down steadily to just over 100 grams in 2004. Similarly there were downward trend in lamb and fish eaten, about 60 grams and 40 grams respectively in 2004. In contrast the amount of chicken consumption enjoyed a significant increase from 150 grams to over 250 grams in 2004.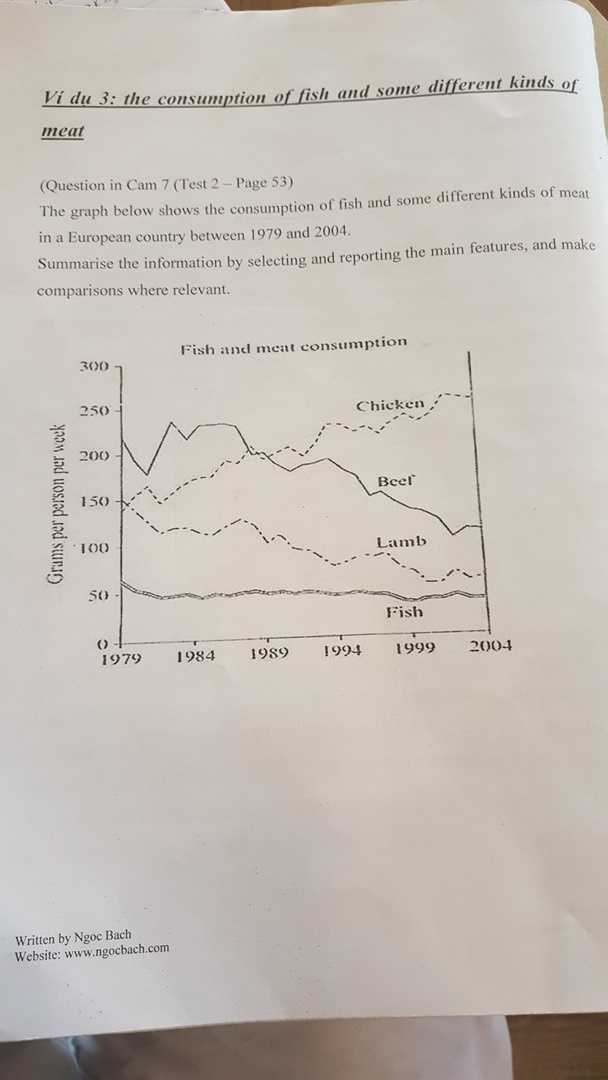
Get the Weekly English Kit 📬
New words, one handy idiom, and a 2-minute quiz — delivered to your inbox to keep your streak alive.
0 Answers
 Related Questions