
Please help me to correct
The graph below shows the population change between 1940 and 2000 in three different counties in the U.S. state of Oregon.
Summarise the information by selecting and reporting the main features, and make comparisons where relevant.
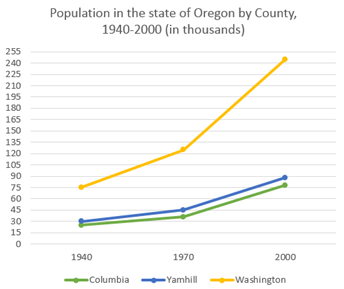
The line graph compares the change of population scale in Columbia, Yamhill and Washington from 1940 to 2000.
It is clear that the number of residents who lived in Washington was much higher than that in the other county over the period shown. Furthermore, all three counties saw a similar increasing trend in population.
In the year 1940, the population of Columbia and Yamhill was close to 30 thousand people while this figure for Washington was over 70 thousands. By 1970, the number of people who lived in Washington had risen dramatically to around 120 thousand meanwhile there was only a slight change in the population scale of 2 remained counties.
From 1970 to 2000 witnessed the population boom in Washington, in 2000 the population of this county reached a peak of approximately 245 thousand people. By contrast, the population in Yamhill increased significantly to around 90 thousand people – 15 thousand higher than that in Columbia.
Get the Weekly English Kit 📬
New words, one handy idiom, and a 2-minute quiz — delivered to your inbox to keep your streak alive.
 Related Questions